
In this technical blog, we will look at the past performance of 1-hour Elliott Wave Charts of Bitcoin. In which, the decline from 15 August 2022 high is unfolding as a nest and showed a lower low sequence. Therefore, we knew that the structure in Bitcoin is incomplete to the downside & should see more weakness. So, we advised members to sell the bounces in 3, 7, or 11 swings at the blue box areas. We will explain the structure & forecast below:
Bitcoin 1 Hour Elliott Wave Chart
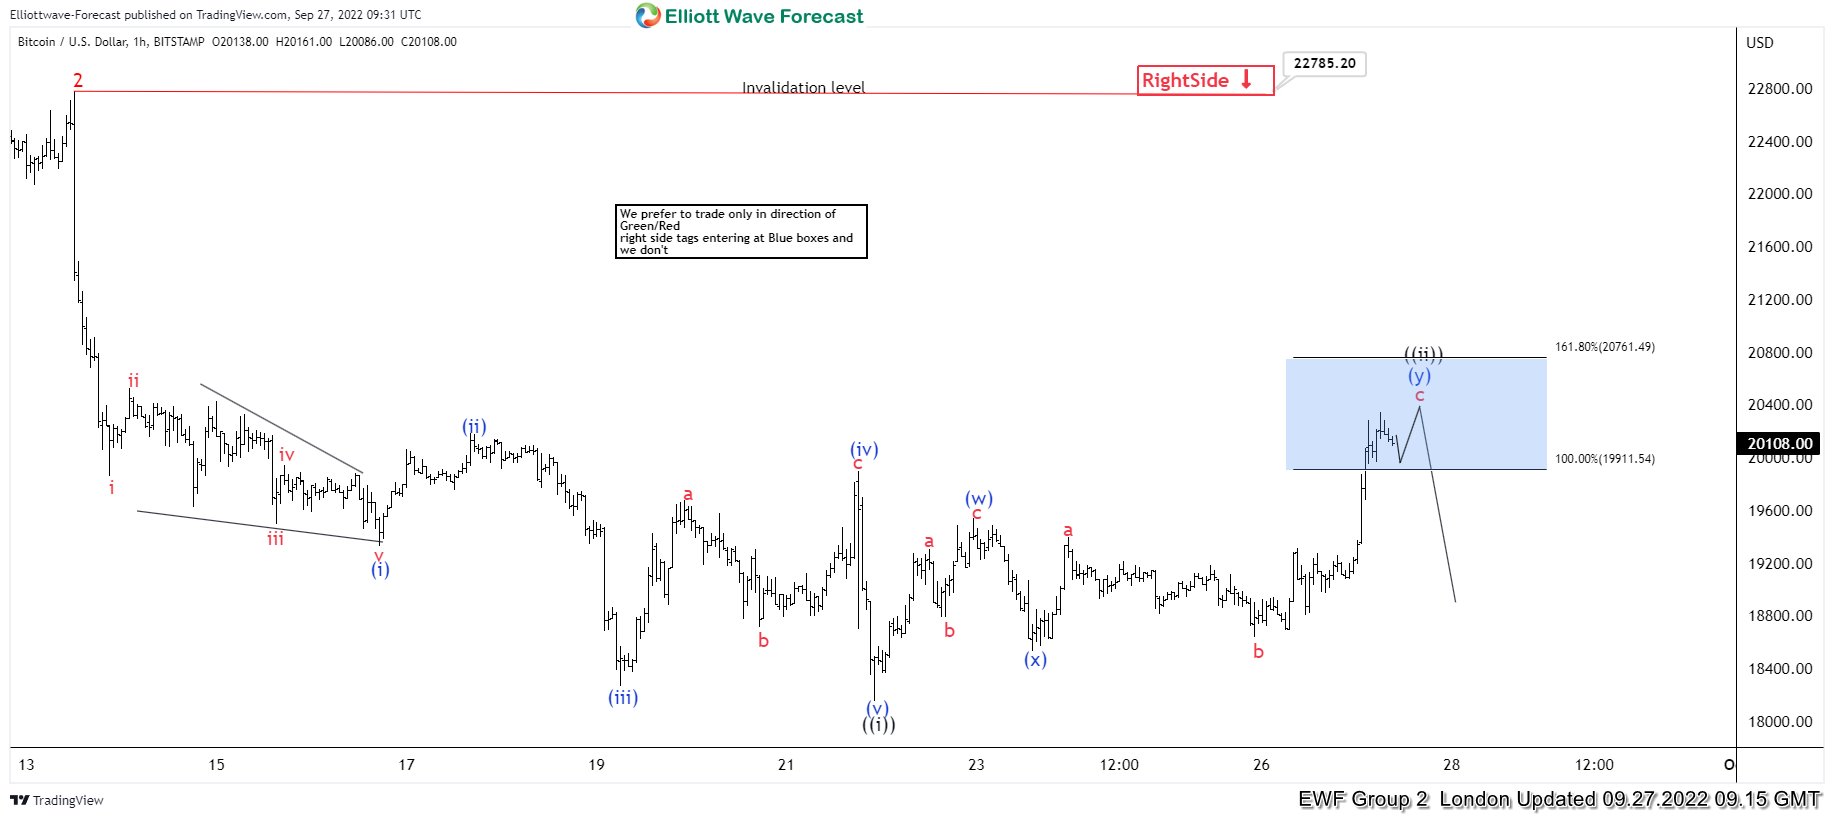
Here’s 1hr Elliott wave Chart from the 9/27/2022 London update. In which, the decline to $18157 low ended 5 waves from 9/13/2022 high in wave ((i)) & made a bounce in wave ((ii)). The internals of that bounce unfolded as an Elliott wave double correction where wave (w) ended at $19541 high. Then a decline to $18533 ended wave (x) pullback and started the (y) leg higher towards $19911- $20761 blue box area from where sellers were expected to appear looking for more downside or for a 3 wave reaction lower at least.
Bitcoin Latest 1 Hour Elliott Wave Chart
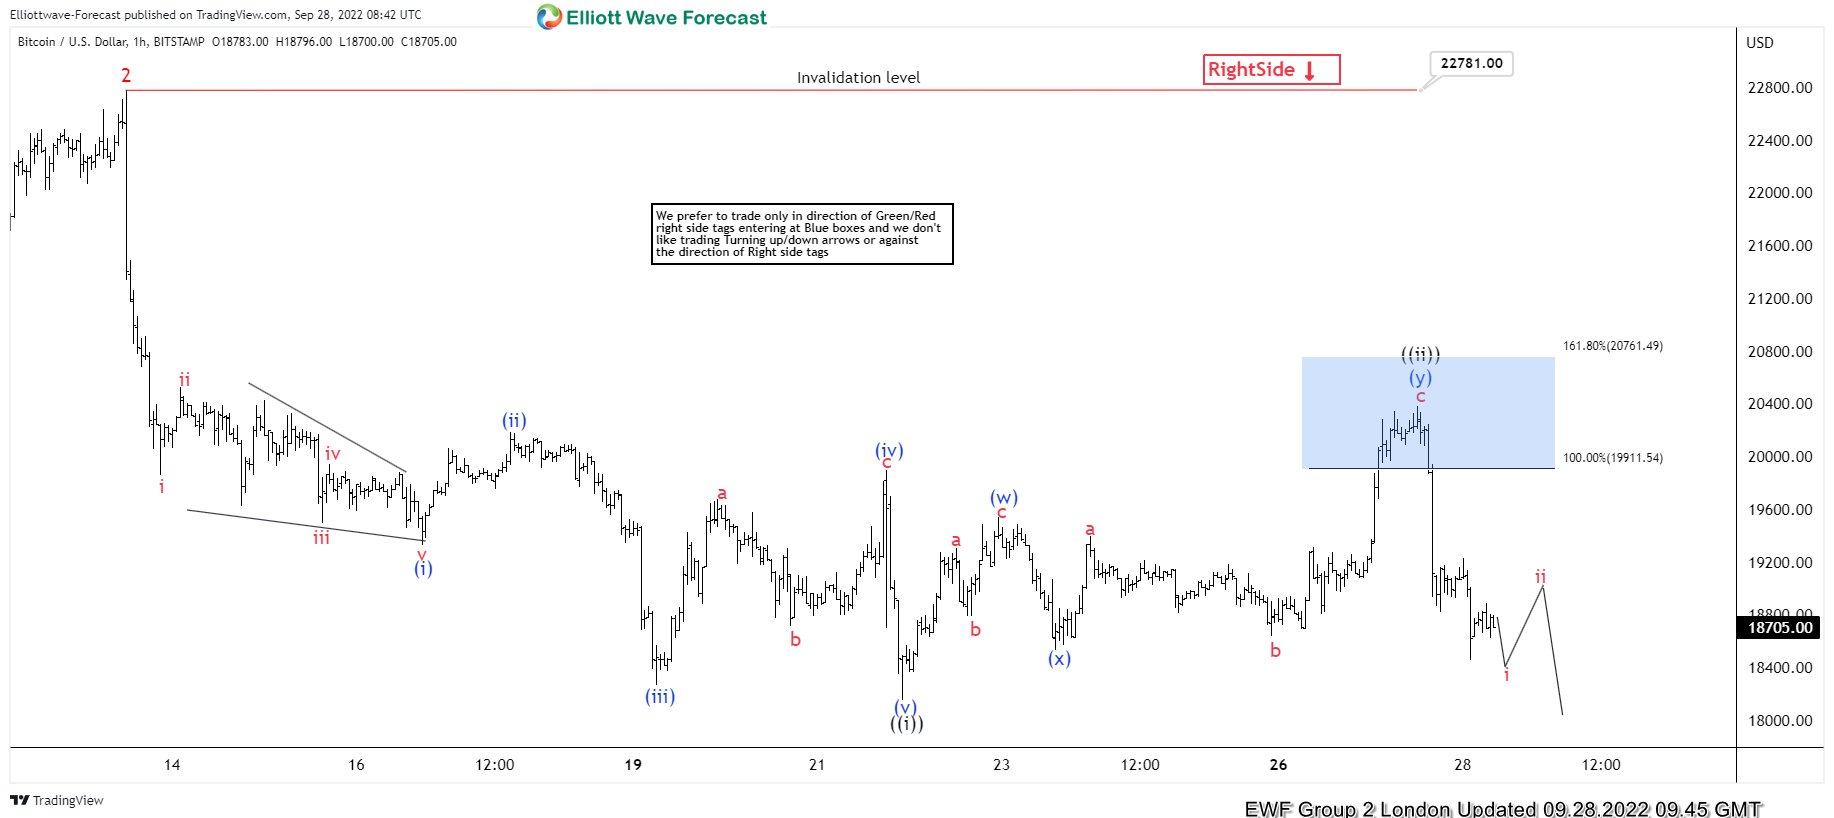
This is the Latest 1hr view from the 9/28/2022 London update. In which the Bitcoin is showing a reaction lower taking place from the blue box area allowing shorts to get into a risk-free position shortly after taking the position. However, a break below $18157 low still needs to be seen to confirm the next extension lower towards $15773- $14685 area lower & avoid double correction higher.
Source: https://elliottwave-forecast.com/cryptos/bitcoin-reacting-lower-blue-box-area/