
The Euro continues to slide against many other major currencies after Russia stopped the gas supplies. The deepening energy crisis causes fear of a recession in the Euro area. Europe has tried to diversify its energy sources and build up reserves, but it’s not possible to totally avert the hit to the economy. In the charts below, we will look at the Elliott Wave chart of the pair.
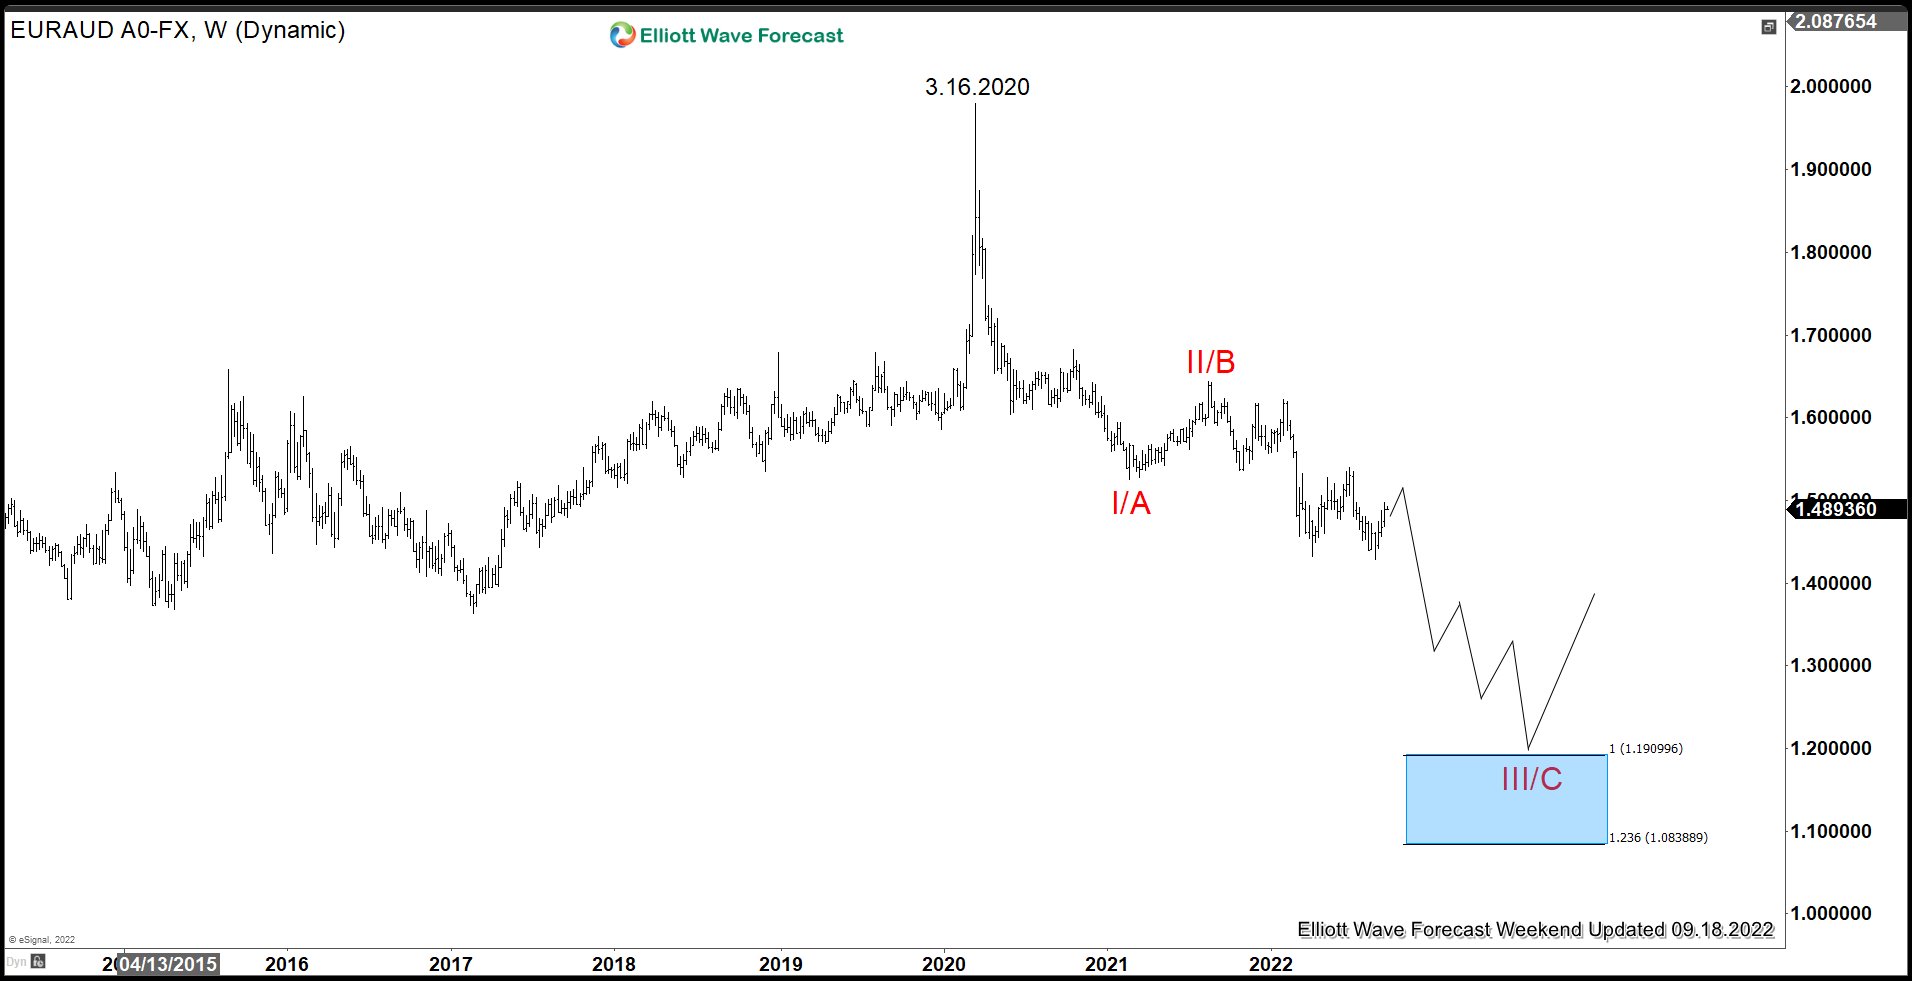
EURAUD Weekly Elliott Wave Chart
Weekly Elliott Wave view of EURAUD above suggests that the pair shows a lower low sequence from 3.16.2020 high favoring further downside. While pair stays below wave II/B high at 1.6436, rally should fail in 3, 7, or 11 swing for further downside to reach the blue box area of 1.084 – 1.019.
EURAUD 4 Hour Elliott Wave Chart
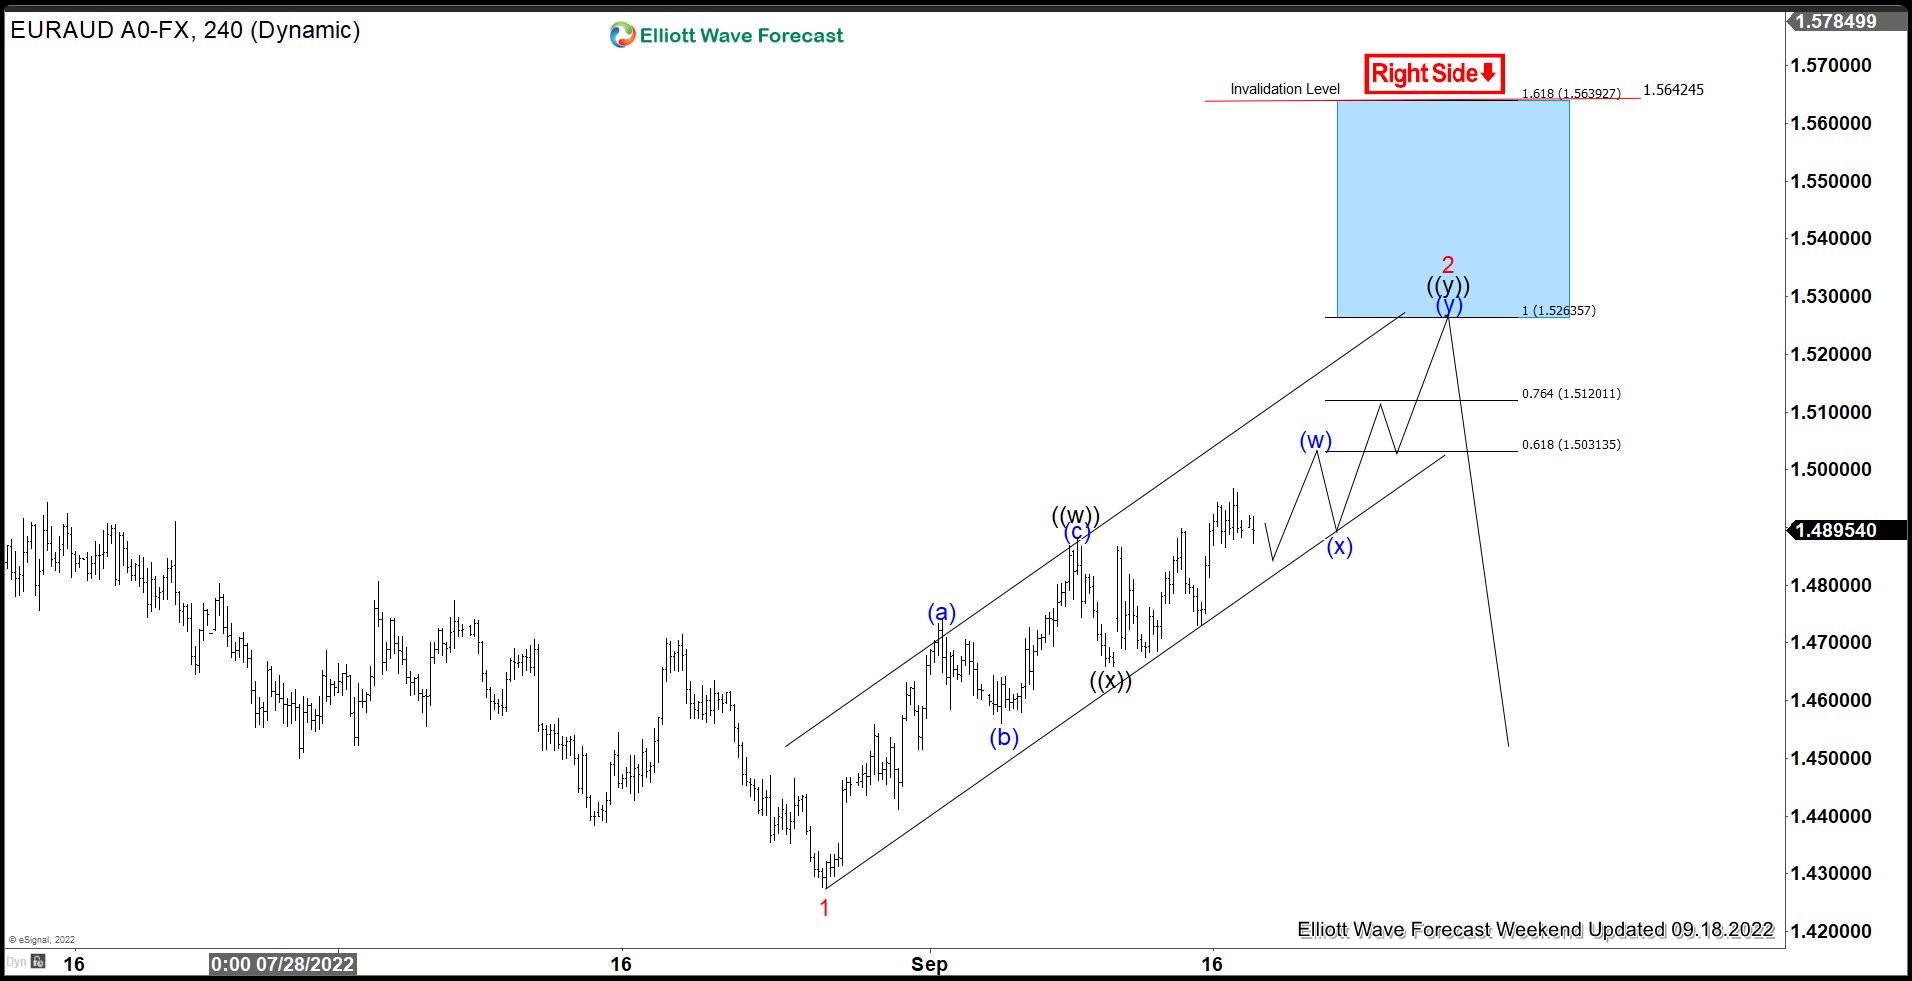
4 Hour Elliott Wave View of EURAUD above shows that the rally from 8.26.2022 low takes the form of a double three structure. A double three is a 3-3-3 structure with label of ((w))-((x))-((y)). The target higher in this case is ((y)) = 100% – 161.8% Fibonacci extension of ((w)) at 1.526 – 1.564 area. From this area, pair could end the 7 swing rally and extends lower or at least pullback in 3 waves.
Source: https://elliottwave-forecast.com/forex/euraud-shows-bearish-sequence-favoring-downside/