HeidelbergCement is a German multinational building materials company. Today, it is the largest producer of construction aggregates in the world. It is number 2 in production of cement and number 3 worldwide in ready mixed concrete. Founded in 1874 and headquartered in Heidelberg, Germany, HeidelbergCement is a part of DAX40 index. One can trade it under the ticker $HEI at XETRA.
In the initial article from October 2021, we have explained that the pullback from April 2021 offers an opportunity. Now, we see a connector in place and we are able to identify next buying are. Here, we provide an update.
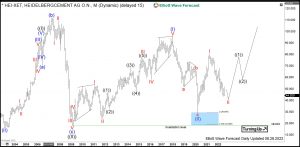
HeidelbergCement Monthly Elliott Wave Analysis 08.28.2022
The monthly chart below shows the HeidelbergCement stock $HEI traded at XETRA. From all-time lows, the stock price has developed a strong initial nest. Just to recall: A nest is a sum of waves 1 and 2 of the same degree. First, black wave ((I)) has ended in May 2006 at 96.11. Then, wave ((II)) has corrected the cycle higher within an expanded flat structure lower. Hereby, wave (b) of ((II)) has printed the all-time highs in April 2007 at 112.03. The consolidation within wave ((II)) has ended in February 2009 at 18.01.
From February 2009 low, a new cycle in wave ((III)) has started. Break above 112.03 highs will confirm that. Within wave ((III)), $HEI is showing a series of nests. First, waves (I)-(II) have ended on March 2020 at 29.00. From there, a second nest is curently in progress. Wave I has ended in April 2021 at 81.04 and wave II should find support above 29.00 lows in 3, 7 or 11 swings. Then acceleration higher in red III of blue wave (III) of black wave ((III)) should take place.

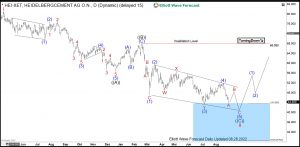
HeidelbergCement Daily Elliott Wave Analysis 08.28.2022
The Daily chart below shows in more detail the pullback in wave II from the April 2021 peak at 81.04. The consolidation pattern is most likely a zigzag pattern. First, impulse in black wave ((A)) has found its bottom in December 2021 at 56.60. Then, a bounce in black wave ((B)) has set connector in February 2022 at 68.08. From there, wave ((C)) has been confirmed by breaking 56.60 lows. Diagonal pattern in black wave ((C)) being 3-3-3-3-3 structure might be currently in the short term bounce as red wave B of blue wave (5). Then, a final move in wave C of (5) into the inflection area should take place.
Investors and traders should be looking to buy $HEI from 43.59-29.00 area for a rally into a red wave III towards 81.04 highs and even higher. As an outlook, wave (III) of ((III)) should extend towards 107.22-155.52 area and possibly higher. The target for the entire wave ((III)) will be 114.42-174.01 area. Current prices offer, therefore, a high profit potential for those who would like to diversify their portfolio by indirect investment in commodities and construction business.

Source: https://elliottwave-forecast.com/stock-market/heidelbergcement-entering-buying-area/

