
Marathon Oil Corporation ticket symbol: MRO engages in the exploration, production, and marketing of liquid hydrocarbons and natural gas. It operates through the following two segments: United States (U. S.) and International. The U. S. segment engages in oil and gas exploration, development, and production activities in the U.S. The International segment engages in oil and gas development and production across international locations primarily in Equatorial Guinea and the United Kingdom. The company was founded in 1887 and is headquartered in Houston, TX. We will look at the Elliott wave analysis below:
MRO Daily Elliott Wave Chart
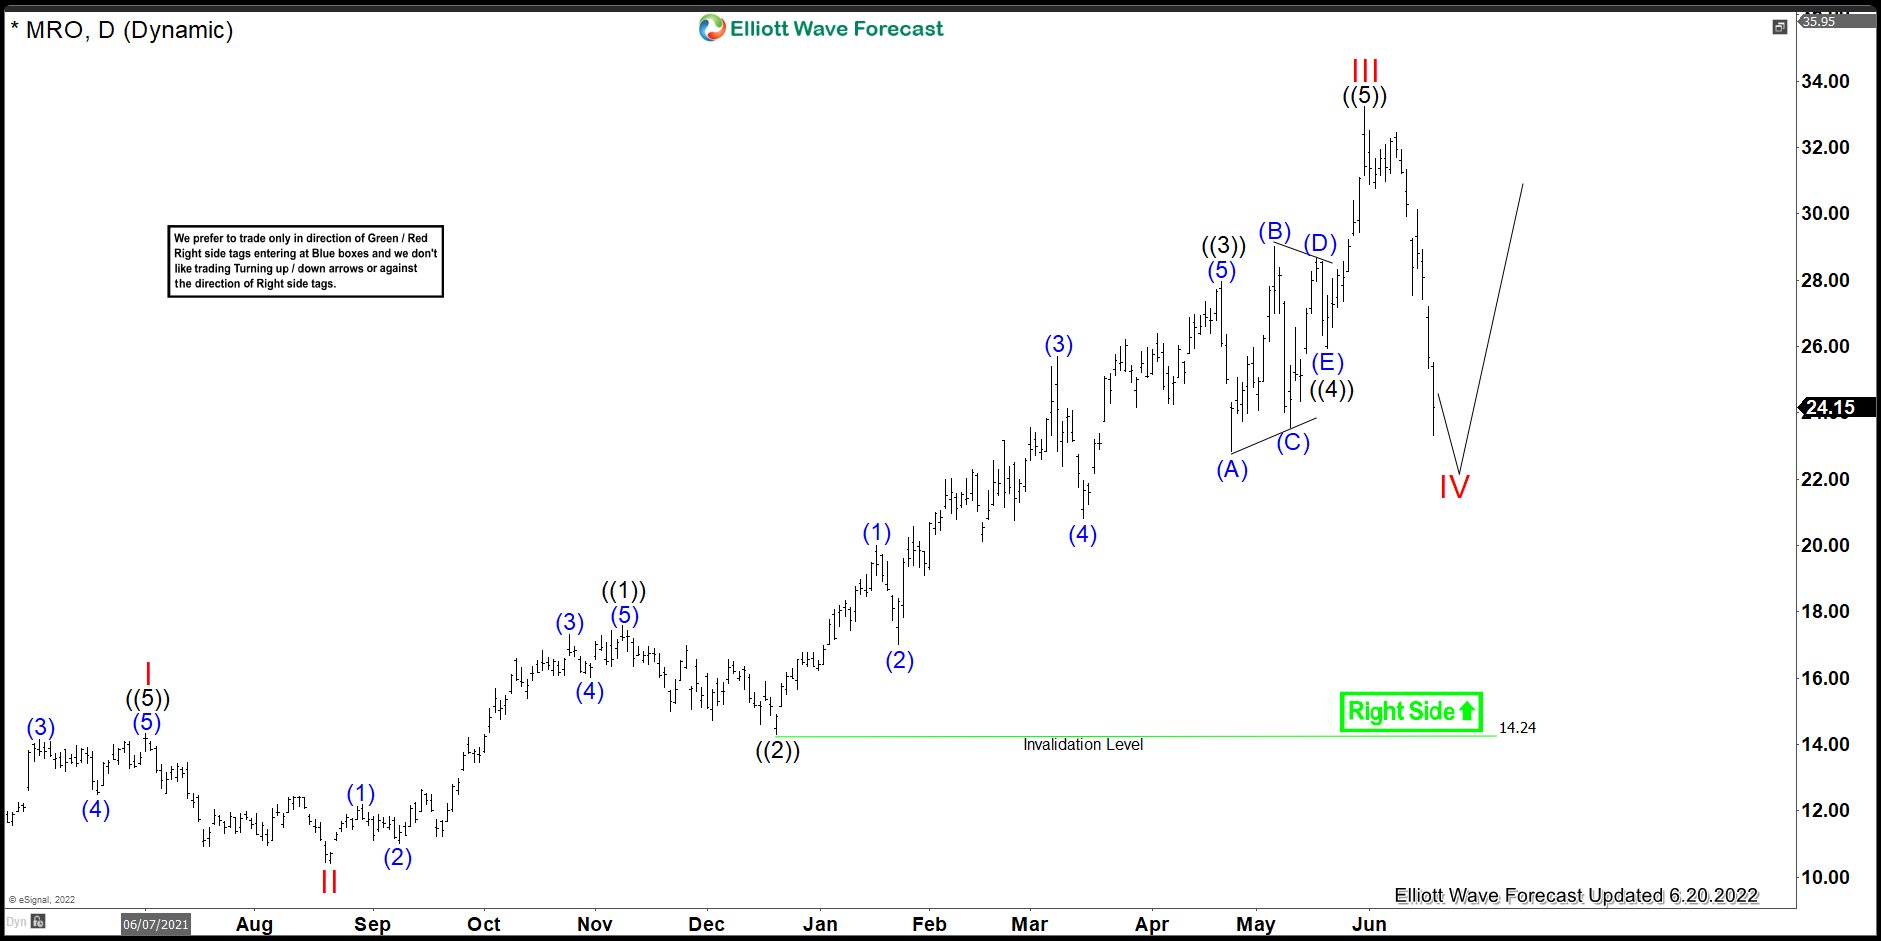
This is the Daily Elliott wave chart of MRO. In which the rally from the April 2020 low is unfolding in an impulse sequence favoring more upside to happen. While the rally to $14.33 high ended wave I, wave II pullback ended at $10.41 low. Then wave III ended at $33.24 high in a lesser degree 5 waves structure. Now looking to do a pullback in wave IV to correct the cycle from the August 2021 low before the upside resume.
MRO 4-Hour Elliott Wave Chart

Above is the 4hr Elliott wave view showing pullback from the peak is unfolding as Elliott wave double three structure. And managed to reach the blue box area at $24.45- $20.94. From where buyers are expected to appear looking for new highs ideally or should do a 3 wave bounce at least. So at this stage of the market sellers need to be very careful because soon a minimum 3 wave reaction higher is expected to take place.
Source: https://elliottwave-forecast.com/stock-market/mro-reaching-short-term-extreme-area/