
Hello fellow traders. Another instrument we have traded lately is USDCAD. As our members know, we’ve been favoring the long side in USDCAD due to incomplete bullish sequences the pair is showing in the weekly cycle from the 05.30. low . In this technical blog we’re going to take a quick look at the Elliott Wave charts of USDCAD, published in members area of the website. We are going to explain the Elliott Wave Patterns and trading strategy.
USDCAD Elliott Wave 4 Hour Chart 06.08.2022
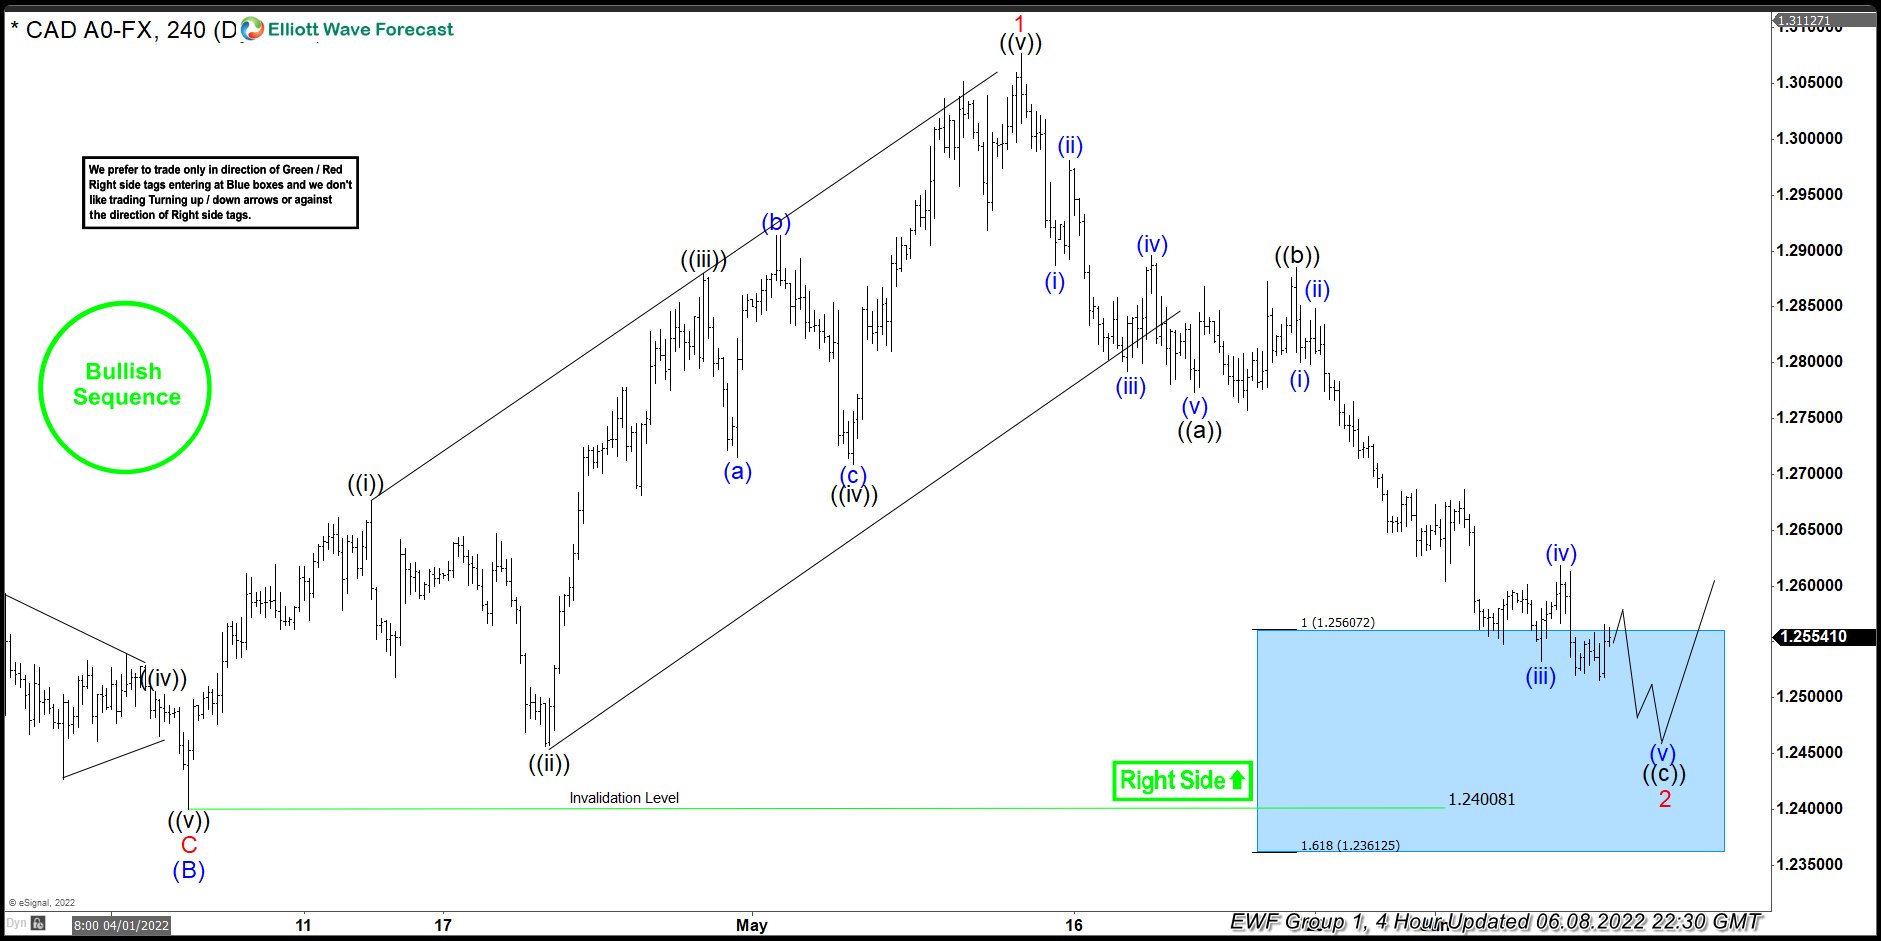
USDCAD ended cycle from the 1.24008 low as 5 waves structure, leading diagonal. We have labeled that cycle as 1 red. Currently the doing 2 red pull back which is unfolding as Elliott Wave Zig Zag pattern. First leg of the pull back looks like 5 waves structure,then we got 3 waves bounce ((b)) and now ending another 5 waves down in ((c)) leg.
We don’t recommend selling the pair against the main bullish trend. The price has already reached extreme zone from the peak at 1.256-1.2400.Strategy is buying the dips in the mentioned zone. As the main trend is bullish we expect buyers to appear at the blue box for 3 waves bounce at least. Once bounce reaches 50 Fibs against the ((b)) black blue high, we will make long position risk free ( put SL at BE).
As our members know, Blue Boxes are no enemy areas , giving us 85% chance to get a bounce.
You can learn more about Elliott Wave Zig Zag Pattern at our Free Elliott Wave Educational Web Page.
USDCAD Elliott Wave 4 Hour Chart 06.11.2022
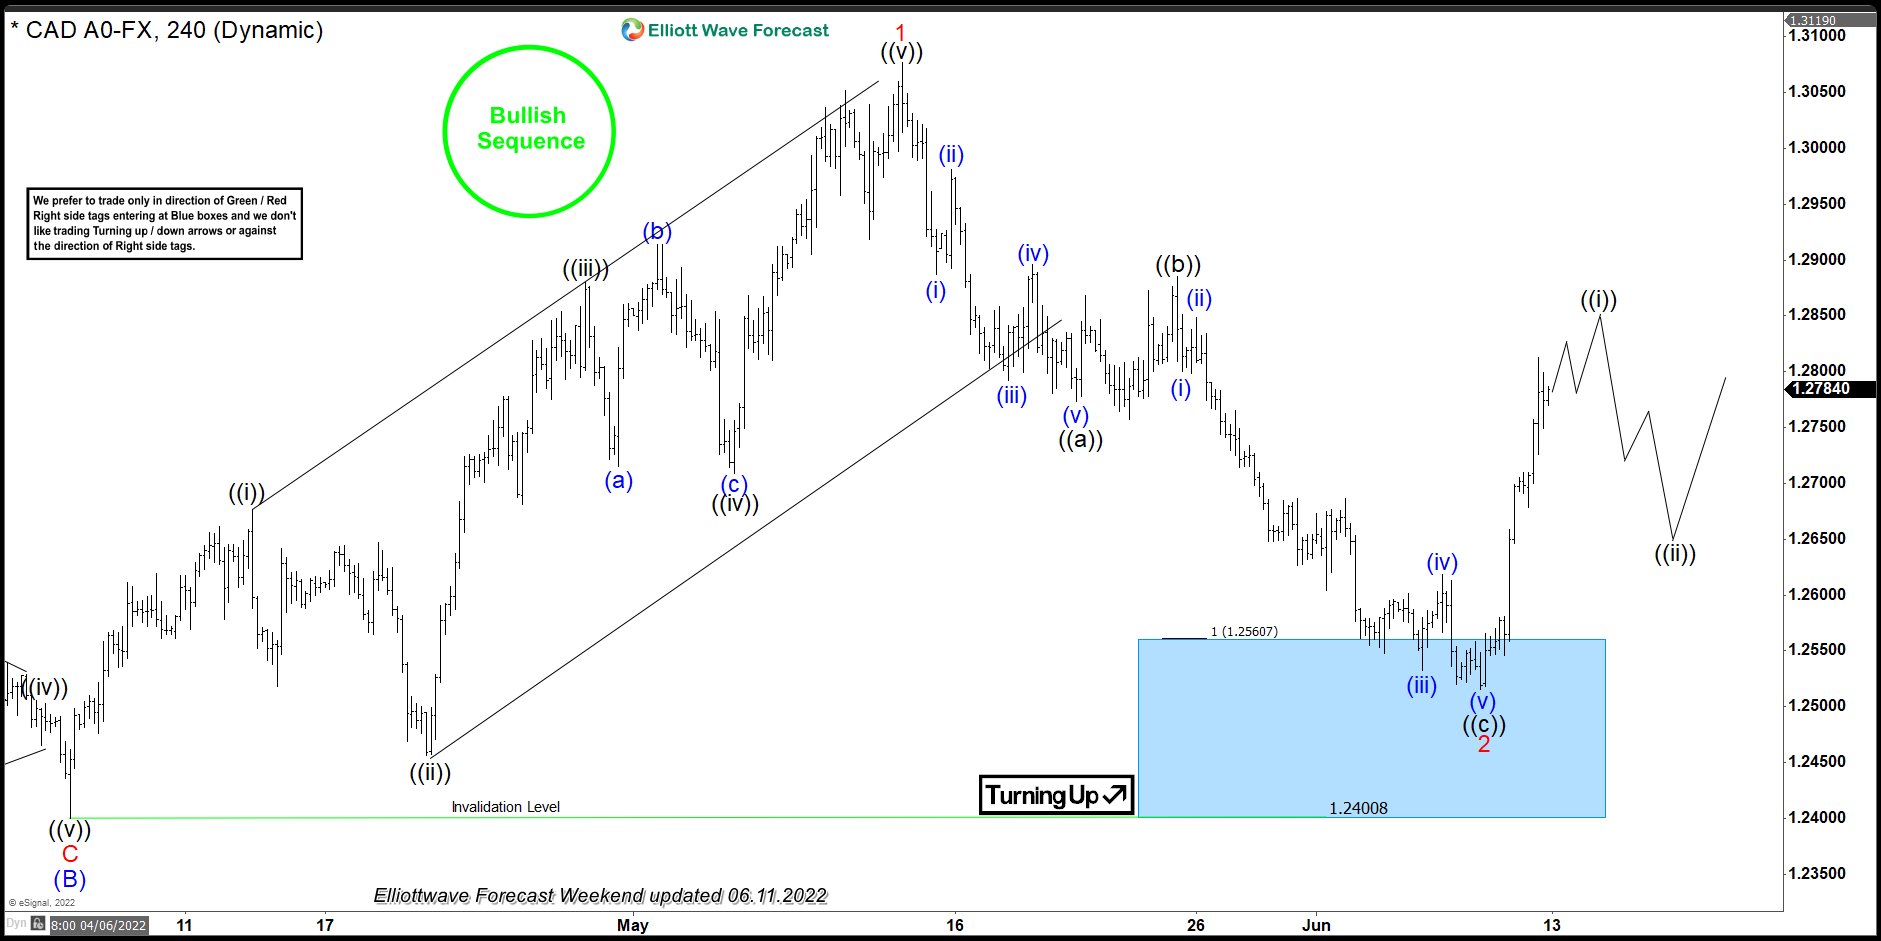
The pair found buyers at the Blue Box area and we are getting good reaction from there. Pull back 2 red is counted completed at 1.2508 low as Elliott Wave Zig Zag pattern. The rally from the blue box already reached and exceeded 50 fibs against the ((b)) connector so,we booked partial profits and made trades risk free ( put SL at BE). Now we need to see break of May 12th peak in order to confirm next leg up is in progress.
Keep in mind that market is dynamic and presented view could have changed in the mean time. You can check most recent charts in the membership area of the site. Best instruments to trade are those having incomplete bullish or bearish swings sequences. We put them in Sequence Report and best among them are shown in the Live Trading Room
Elliott Wave Forecast
Source: https://elliottwave-forecast.com/trading/usdcad-elliott-wave-blue-box-area/