
In this technical blog, we will look at the past performance of the Daily Elliott Wave Charts of SPY. In which, the rally from the 23 March 2020 low unfolded as an impulse and made a pullback to correct that cycle. So, we advised members not to sell it because higher time frames are still favoring more upside in the ETF as a nest. Therefore, our strategy remained to buy the dips in 3, 7, or 11 swings at the blue box areas. We will explain the structure & forecast below:
SPY Daily Elliott Wave Chart
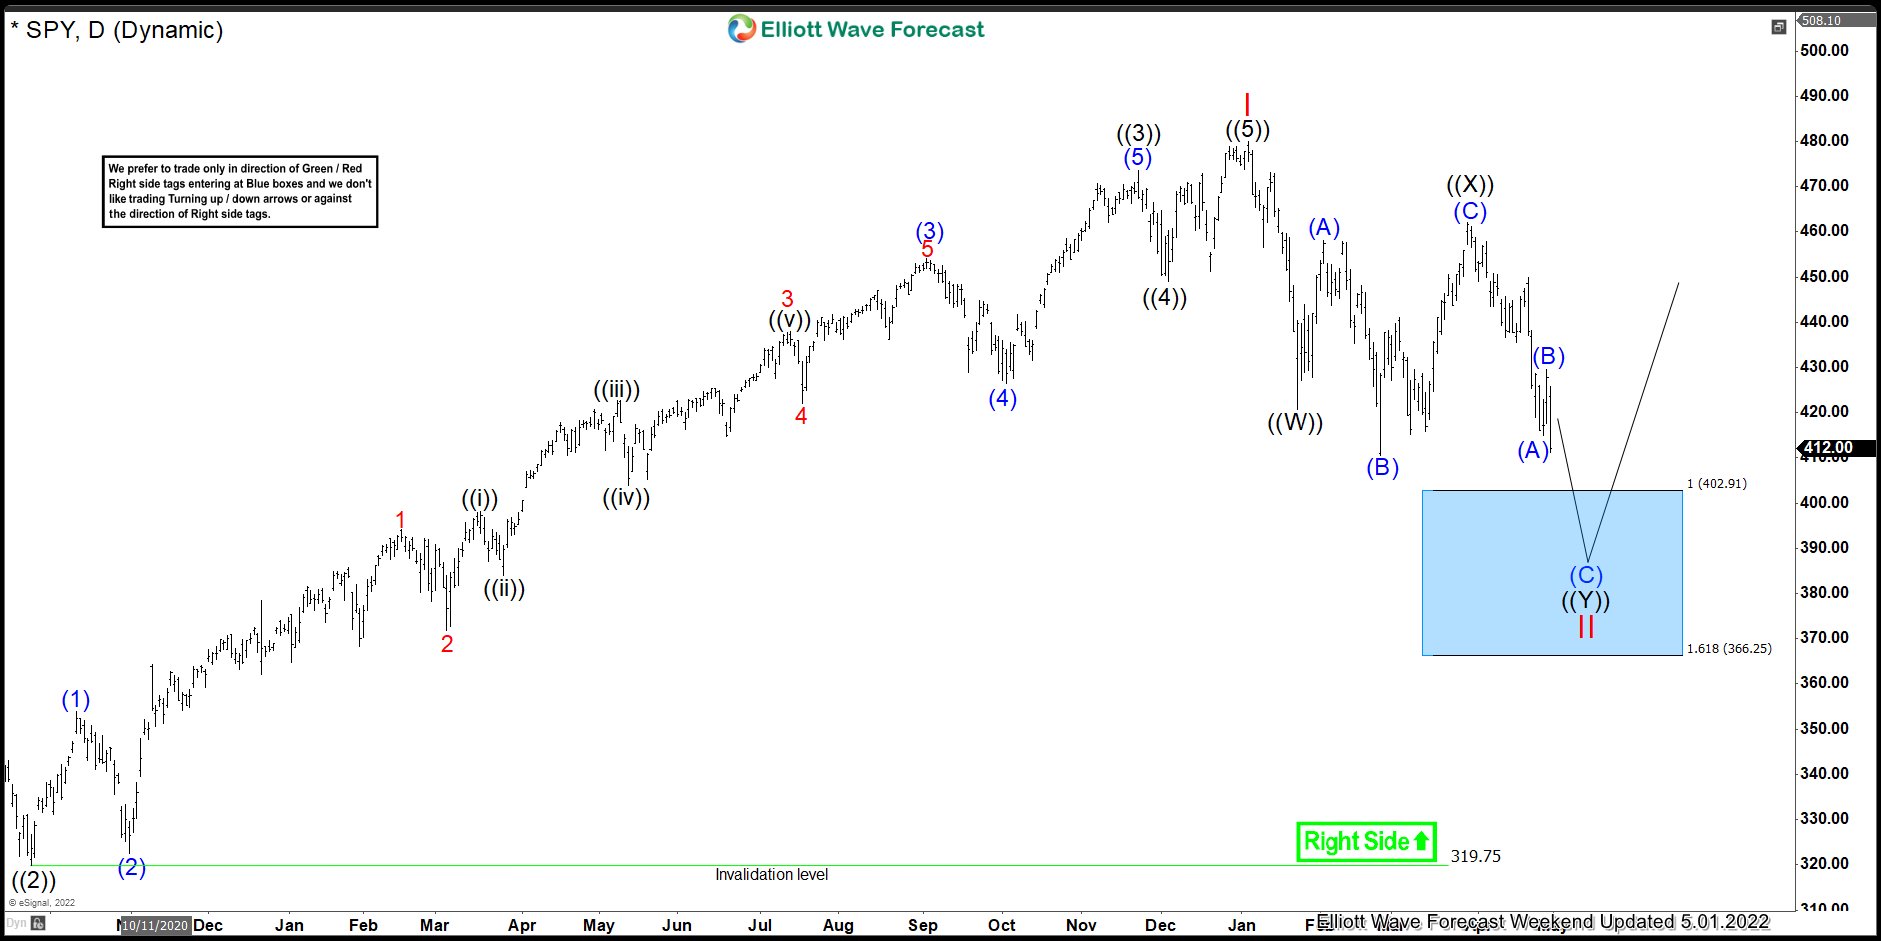
Here’s Elliott wave Chart of SPY from the 5/01/2022 update. In which, the rally to $479.98 high ended the cycle from the 23 March 2020 low & made a pullback. The internals of that pullback unfolded as Elliott wave double three structure where wave ((W)) ended in 5 waves at $420.76 low. Then a bounce to $462.07 high ended wave ((X)) as a flat & started the next leg lower in wave ((Y)) towards $402.91- $366.25 blue box area. From there, buyers were expected to appear looking for new highs ideally or for a 3-wave bounce minimum.
SPY Latest Daily Elliott Wave Chart
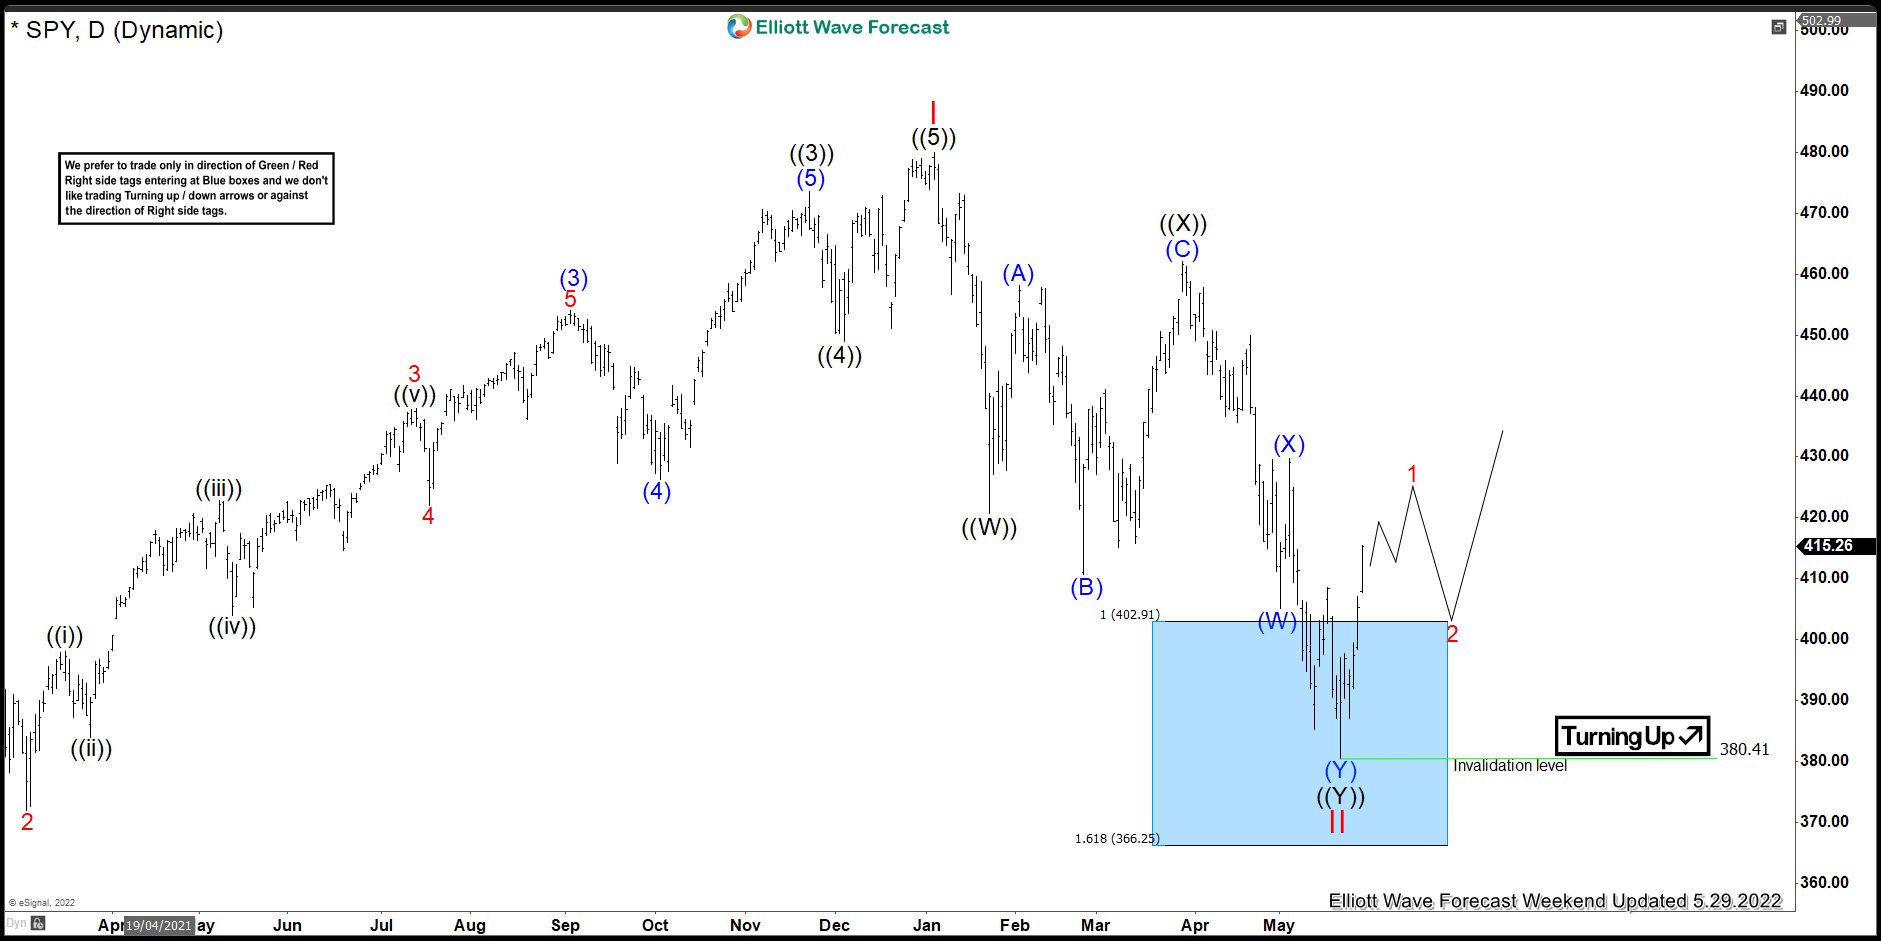
Above is the latest Elliott wave Chart from the 5/29/2022 update. In which the ETF is showing a reaction higher taking place from the blue box area at $402.91- $366.25. Right after ending the double correction within the blue box area. However, a break above $479.98 high is still needed to confirm the next extension higher & avoid double correction lower.
Source: https://elliottwave-forecast.com/stock-market/spy-offered-buying-opportunity/