
$FXB British Pound ETF; Can it Bounce or Not?
Firstly the British Pound Sterling tracking ETF fund FXB inception date was 6/21/2006. The bearish cycle lower from the November 2007 highs in FXB is favored ended in this analysis. The British Pound Sterling has been the currency of the Bank of England since 1694. Considering that date was back before there was a US Dollar to compare with and data readily available suggests price was at 2.6440 in 1972. Spot price in the GBPUSD foreign exchange was 1.0520 in 1995. Price was at 2.1161 in 2007 where it peaked and turned lower. This is where we will shift the focus to the FXB highs at 211.44 in November 2007.
Secondly the bearish cycle from the November 2007 into the January 2009 lows was clearly an Elliott Wave impulse in 5 waves. From there into the August 2009 highs appeared to be three waves. There into the May 2010 lows appeared best as an impulse wave. From there into the July 2014 highs appeared to be an Elliott Wave flat correction. The analysis continues below the monthly chart.
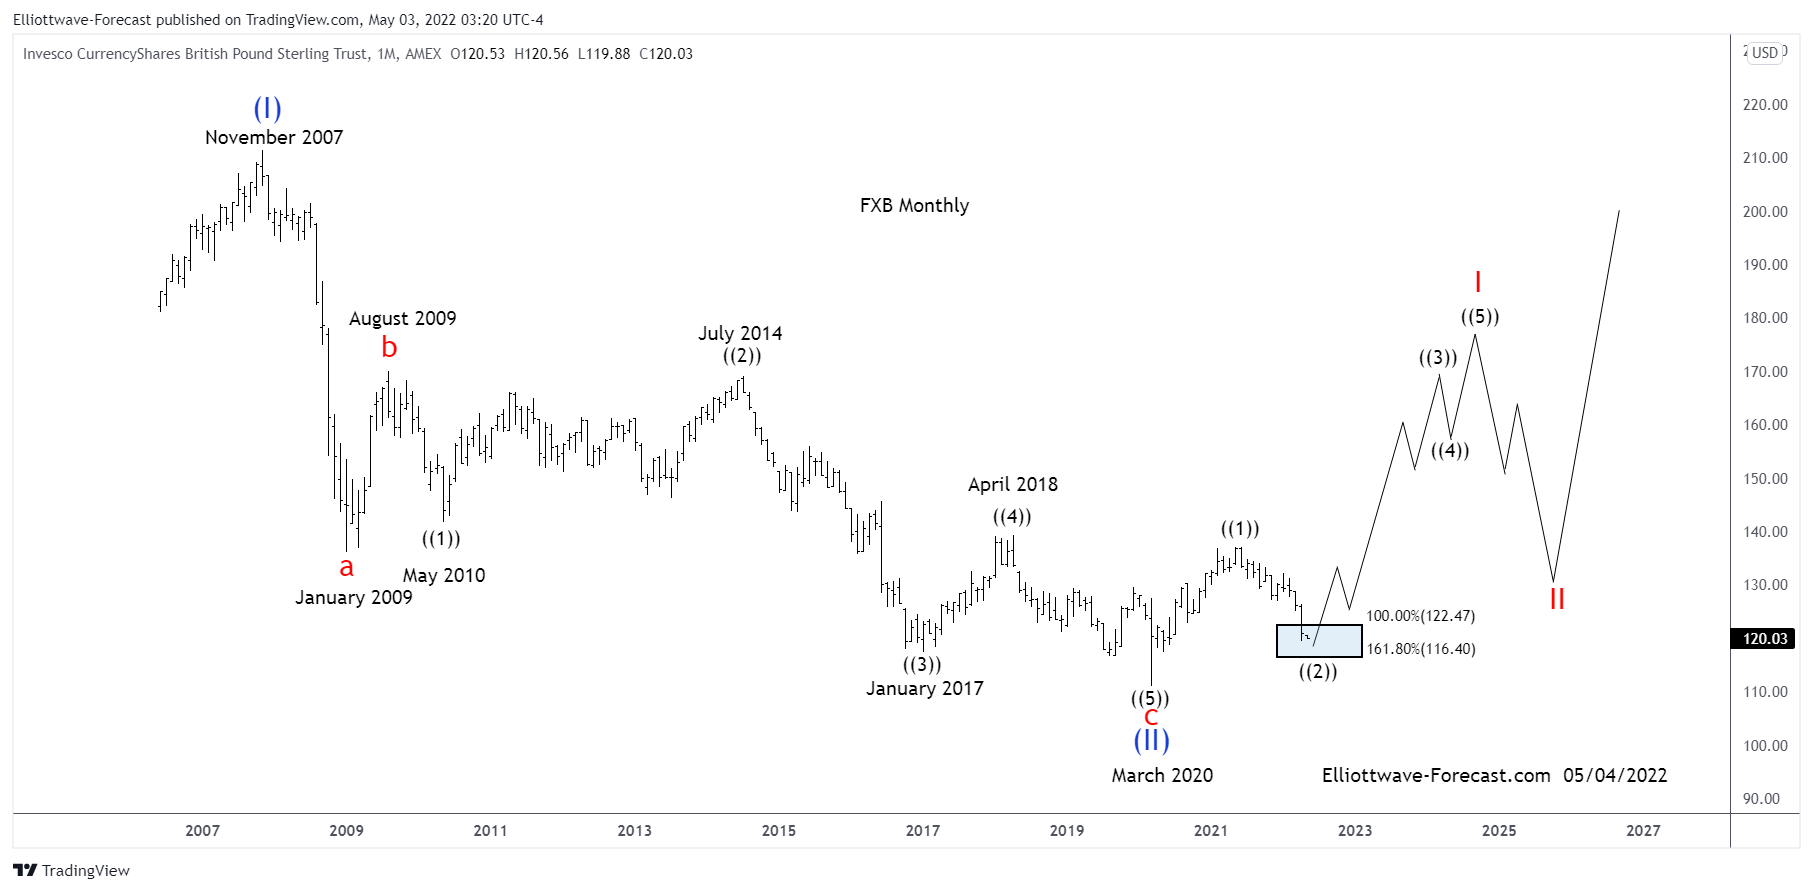
Thirdly the turn lower from the July 2014 highs appears to be an impulse lower into the January 2017 lows. Price appeared to print a double three into the April 2018 highs. From there it appears another impulse completed in March 2020.
In conclusion : As it appears right now the instrument completed a five wave cycle up from the March 2020 lows in May of 2021. The instrument can end a wave ((2)) pullback in the blue box area highlighted to correct the cycle up from the March 2020 lows. While above there the British Pound can continue a longer term cycle higher against the dollar.
Source: https://elliottwave-forecast.com/stock-market/fxb-british-pound-etf-can-it-bounce-or-not/