
SOXX (iShares Semiconductor ETF) is passively managed to provide concentrated exposure to the 30 largest US-listed semiconductor companies. This includes (i) manufacturers of materials with semiconductors that are used in electronic applications or in LED and OLED technology and (ii) providers of services or equipment associated with semiconductors.
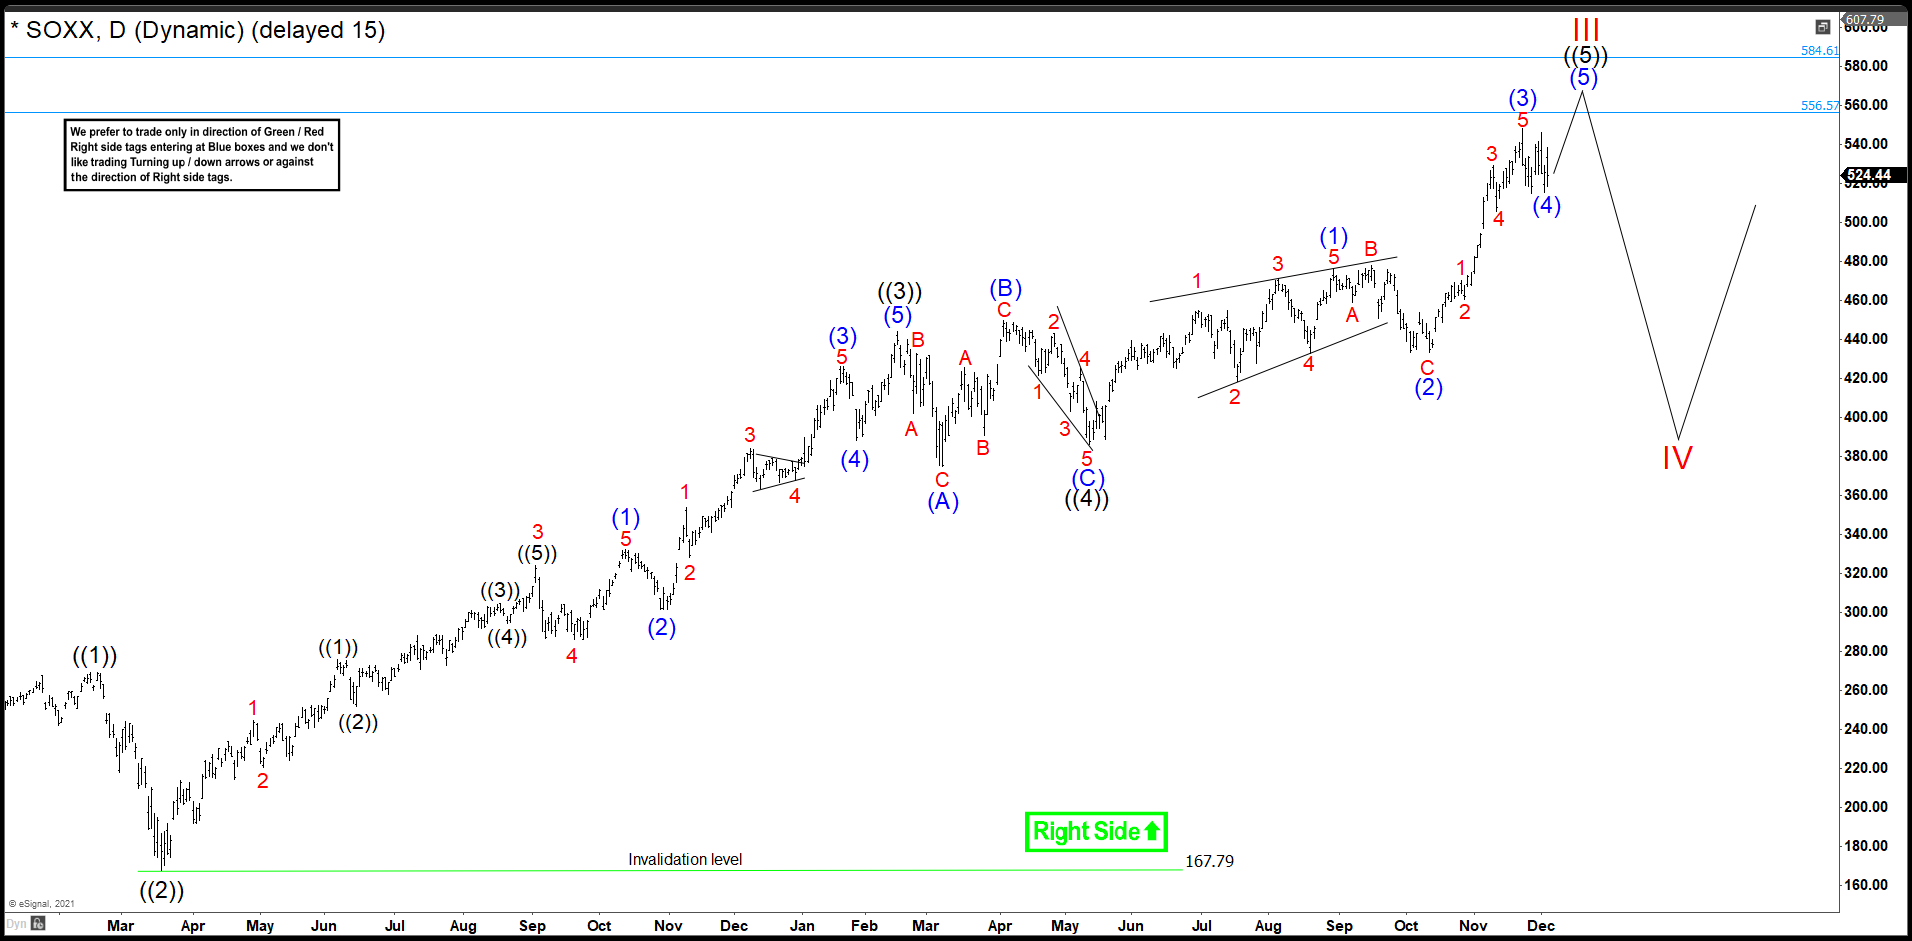
SOXX Daily Chart December 2021
SOXX chart above shows the impulse that we called on December 2021 that began in 2018. You can see 5 waves up and we were looking to complete wave ((5)) in 556.57 – 584.61 area. (If you want to learn more about Elliott Wave Theory, follow these links: Elliott Wave Education and Elliott Wave Theory).
SOXX Daily Chart March 2022
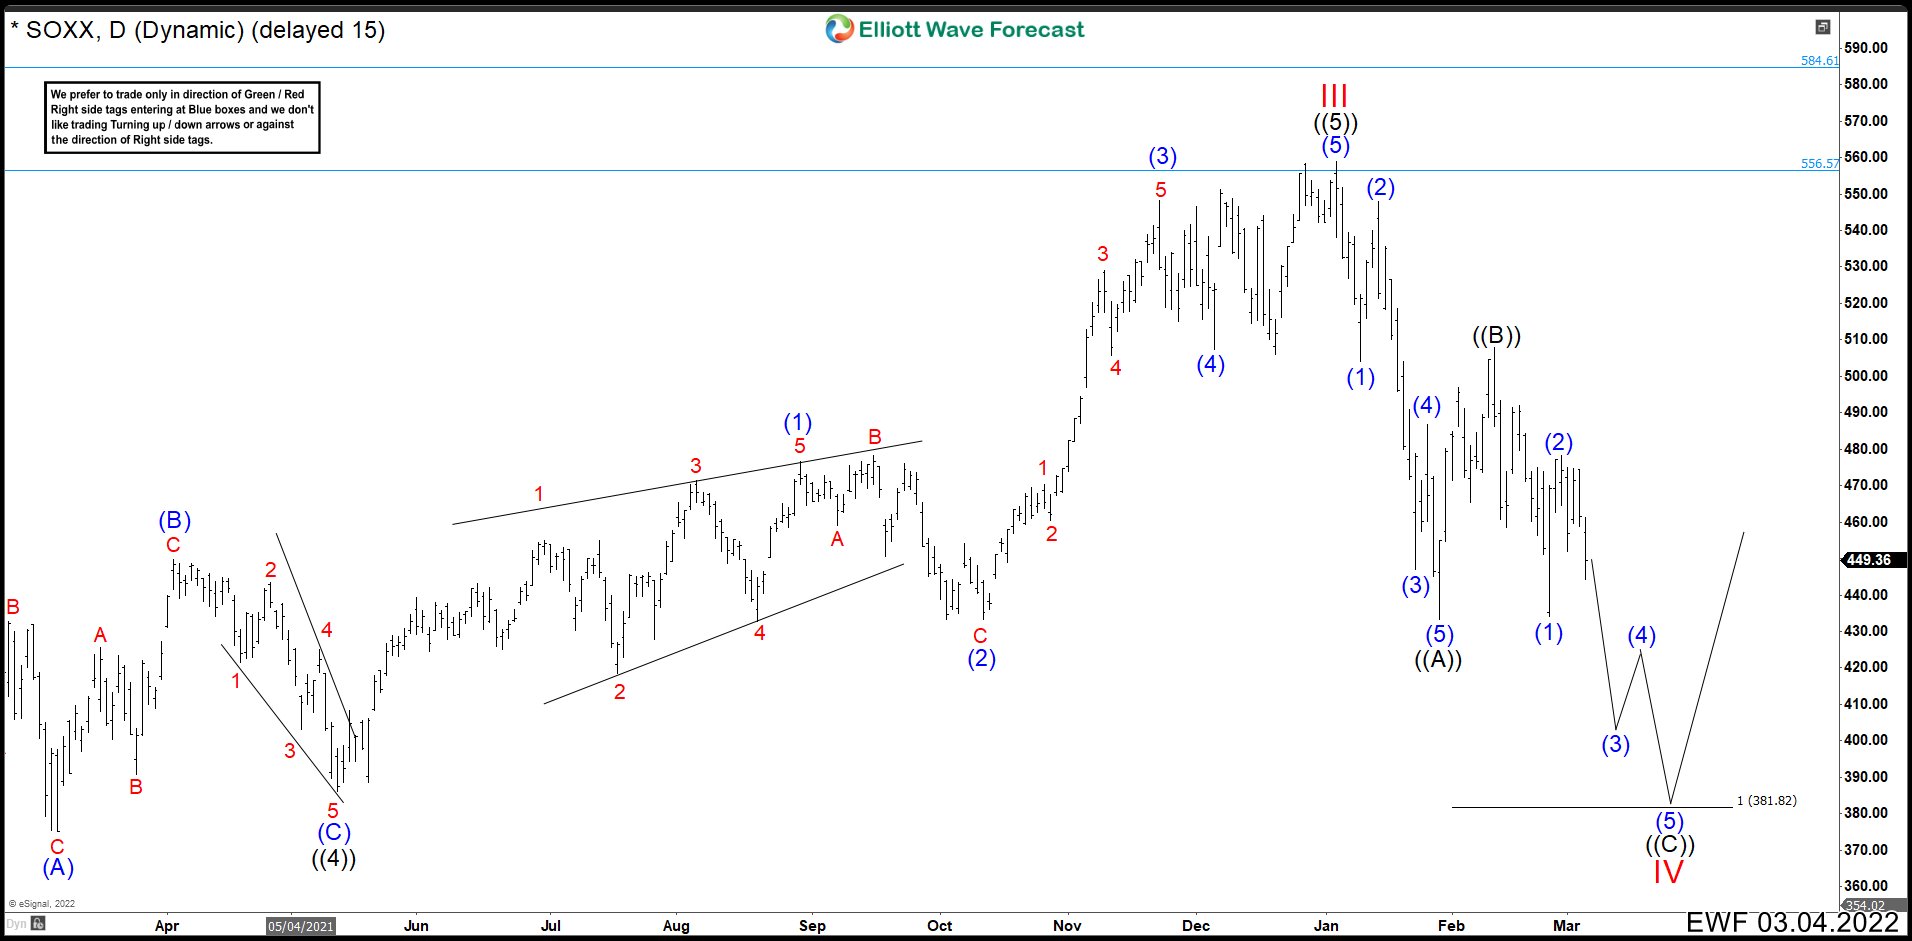
The ETF reached at 559.02 in our target area and reacted down. This completed the wave ((5)) of the impulse from 2018 and also wave III. Then SOXX made 5 waves down bouncing at 433.28 forming a clear impulse structure. This made us to think at first that we will have a simple 3-wave correction to complete wave IV, but at the end the structure has transformed in a double correction.
SOXX Daily Chart April 2022
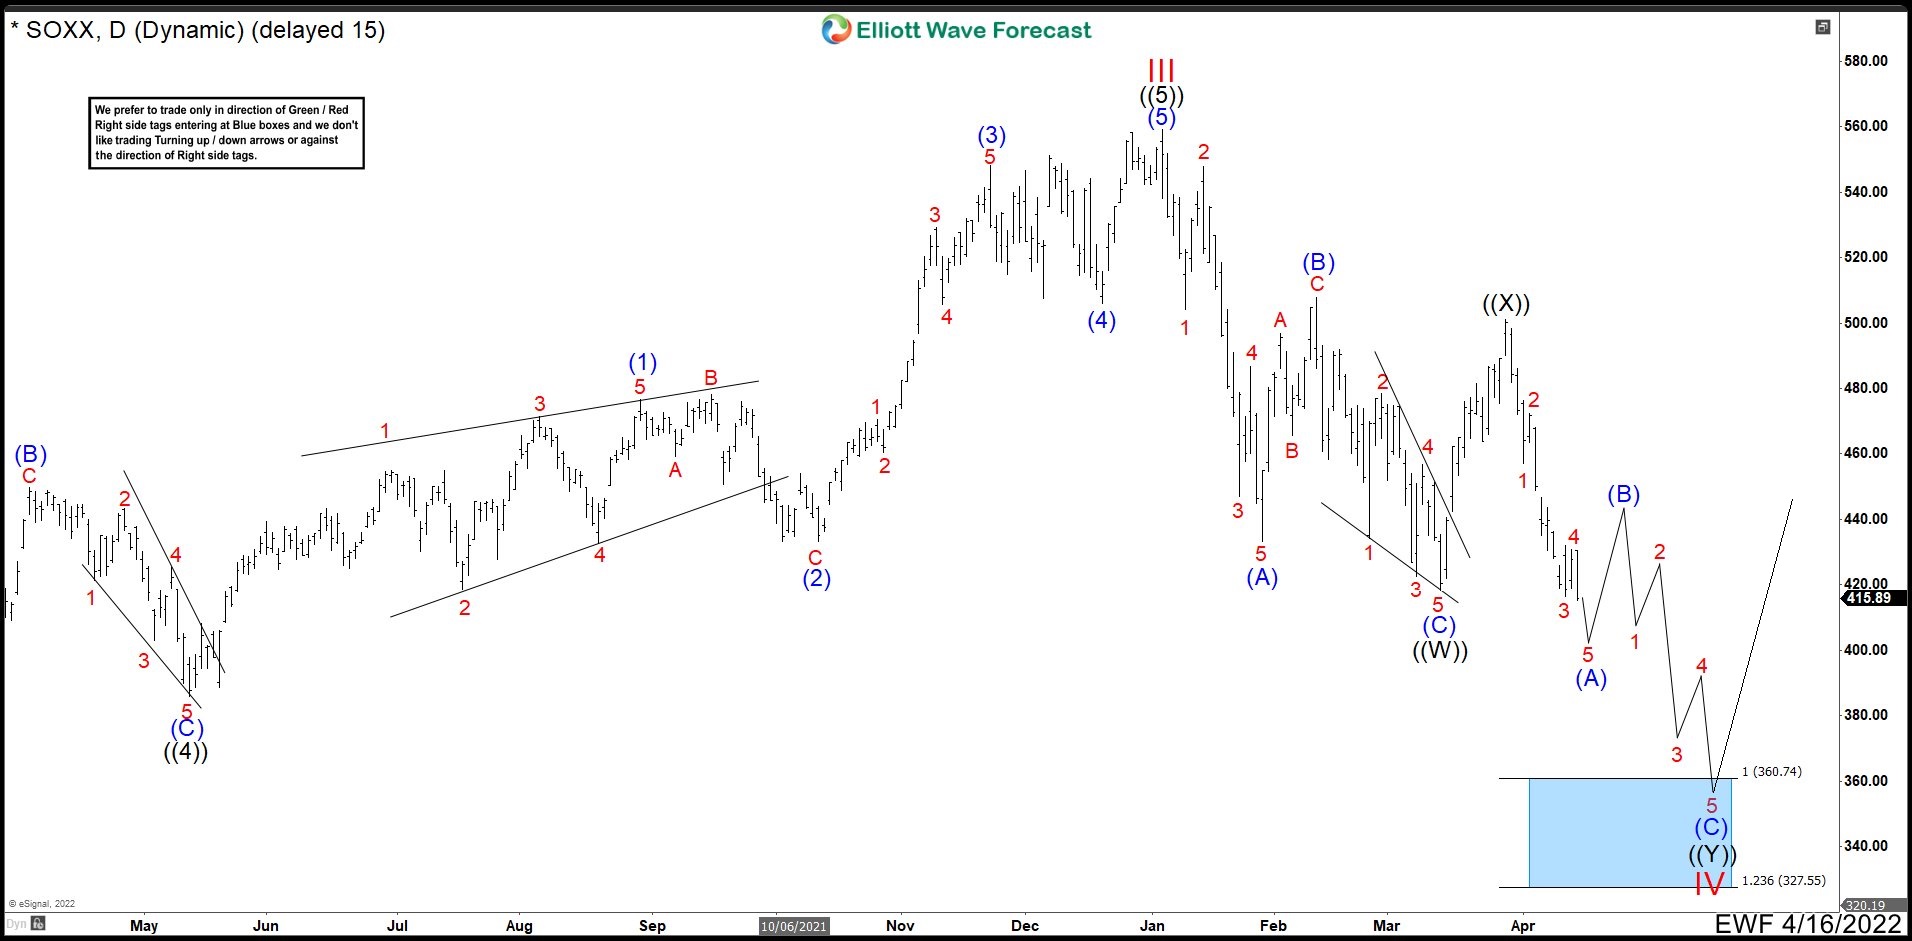
In this new update, we can see 3 swings down from the peak. Wave (A) made an impulse ending at 433.28. Wave (B) pullback built a zig zag correction ending at 507.88. Last wave (C) down made an ending diagonal pattern completing at 418.36 and also the first 3 waves structure as wave ((W)). SOXX rallied almost reached the 61.8% Fib retracement of wave ((W)) being rejected at 501.09 and we called wave ((X)).
The market continued to fall and it is currently close to end an impulse that would be wave (A). Therefore, any rebound that we see should be corrective and be rejected by the market to continue the bearing momentum. This drop could reach 360.74 – 327.55 zone to complete wave ((Y)) of the double correction and wave IV. From this area SOXX should continue the rally and break the peak of 559.02
Elliottwave Forecast updates one-hour charts 4 times a day and 4-hour charts once a day for all our 78 instruments. We do a daily live session where we guide our clients on the right side of the market. In addition, we have a chat room where our moderators will help you with any questions you have about what is happening in the market.
Source: https://elliottwave-forecast.com/stock-market/etf-soxx-needs-double-correction/