
Hello Fellow Traders. In this technical article we’re going to take a look at the Elliott Wave charts charts of AMD stock published in members area of the website. As our members know AMD is trading within the cycle from the 11/30 2021 peak that potentially having a form of Elliott Wave Double Three structure. Recently the stock corrected the short term cycle from the February peak ( 133.48). Recovery unfolded as Elliott Wave Irregular Flat structure. Once target area was reached, AMD stock found sellers as expected and made turn lower. In further text we’re going to explain the forecast and Elliott Wave Pattern.
Before we take a look at the real market example of Expanded Flat, let’s explain the pattern in a few words.
Elliott Wave Expanded Flat Theory
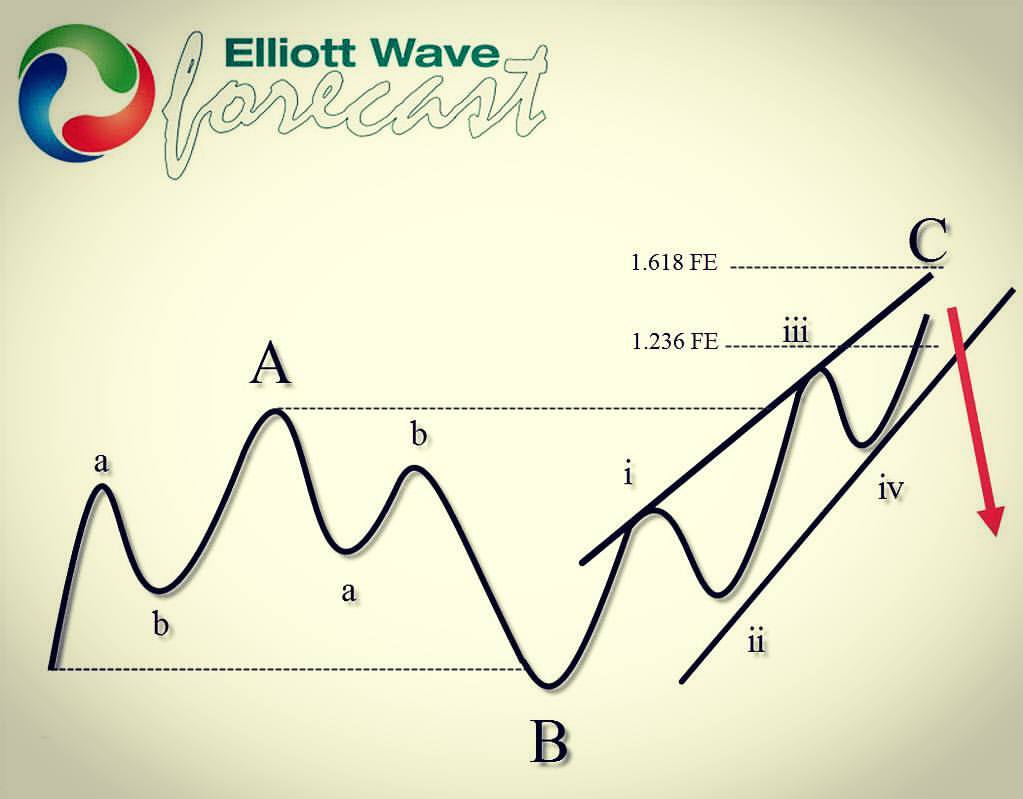
Elliott Wave Flat is a 3 wave corrective pattern which could often be seen in the market nowadays. Inner subdivision is labeled as A,B,C , with inner 3,3,5 structure. Waves A and B have forms of corrective structures like zigzag, flat, double three or triple three. Third wave C is always 5 waves structure, either motive impulse or ending diagonal pattern. It’s important to notice that in Irregular Flat Pattern wave B completes below the starting point of wave A. Wave C ends above the ending point of wave A . Wave C of Flat completes usually between 1.00 to 1.236 Fibonacci extension of A related to B, but sometimes it could go up to 1.618 fibs ext.
At the graphic below, we can see what Expanded Flat structure looks like
Now, let’s take a look what Elliott Wave Flat Pattern looks like in the real market
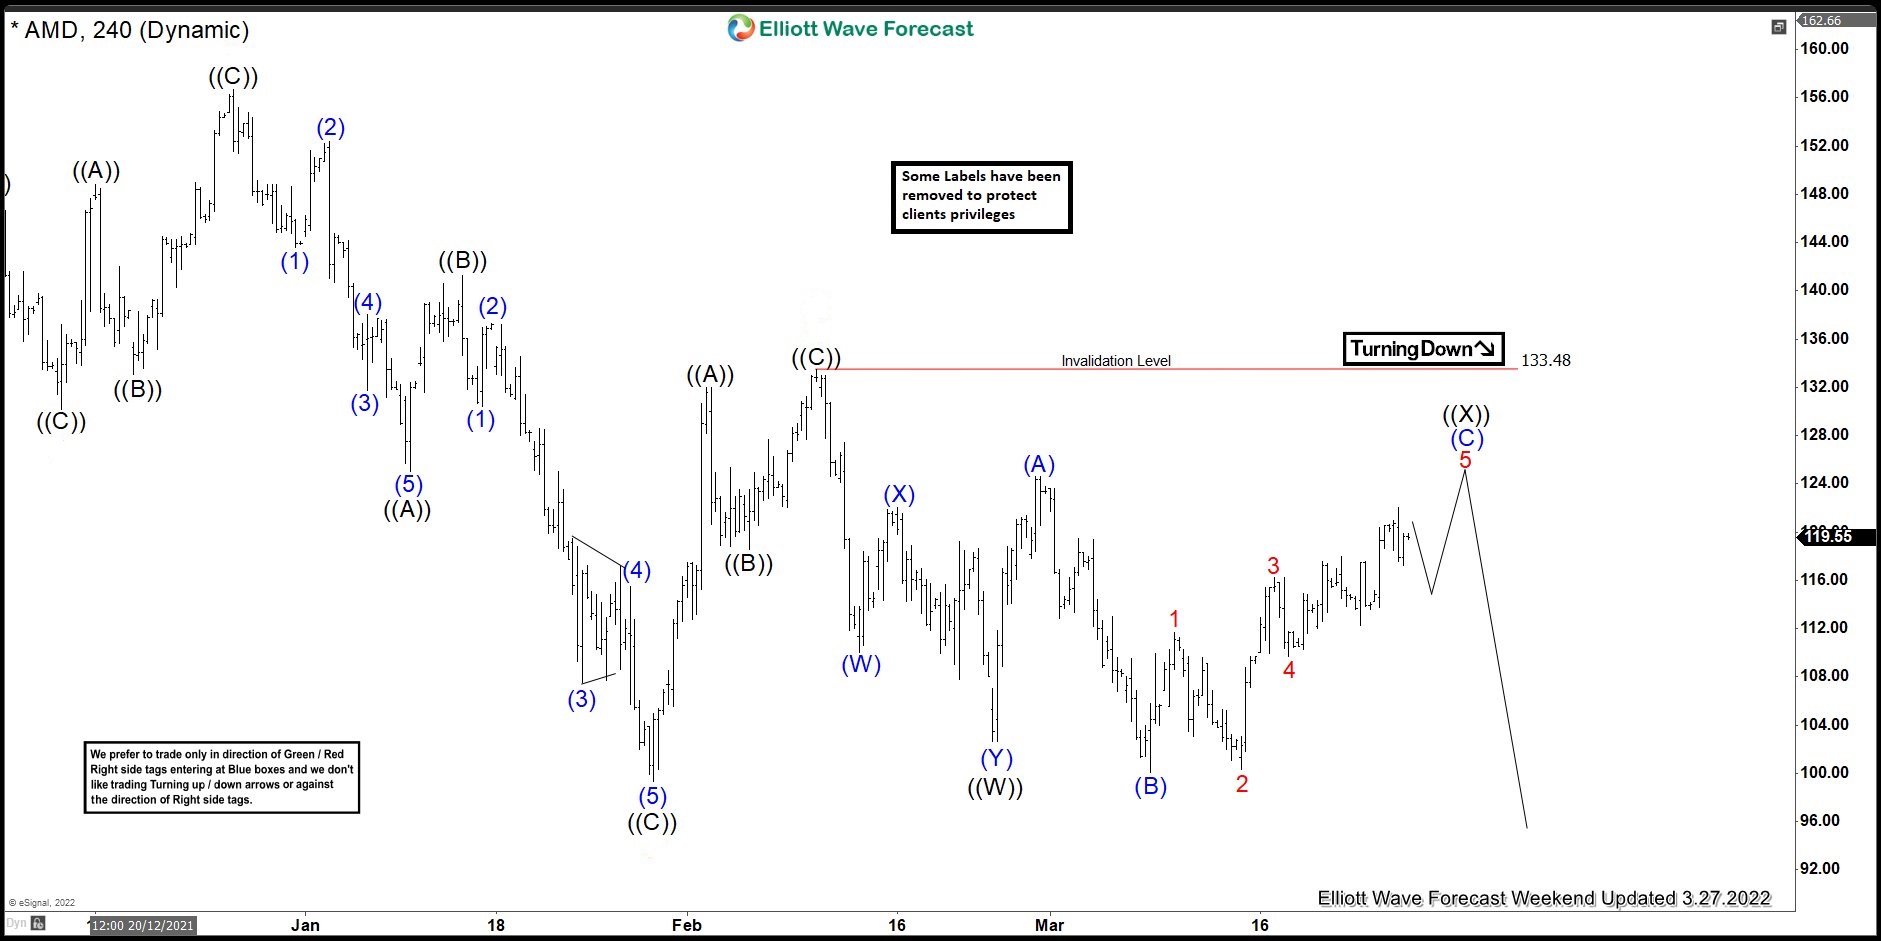
AMD 4h Hour Elliott Wave Analysis 2.10.2022.
AMD stock is giving us recovery against the February 133.4 peak that is unfolding as Flat Pattern. If we downgrade the chart, we can see waves (A )and (B) blue are showing corrective sequences. Wave B red has broken the starting point of A red which suggests this correction can be unfolding either as running or irregular flat. At this stage we call for another marginal push up toward 125.04-132.44 area where ((X)) connector should complete. Proposed area is equal legs – 1.618 fib extension area (A)-(B)) blue. It’s important the price to hold below 133.48 peak, otherwise if that high gets broken the count would be invalidated and it would be doing the correction of higher deegre.
You can learn more about Elliott Wave FLAT and other Patterns at our Free Elliott Wave Educational Web Page
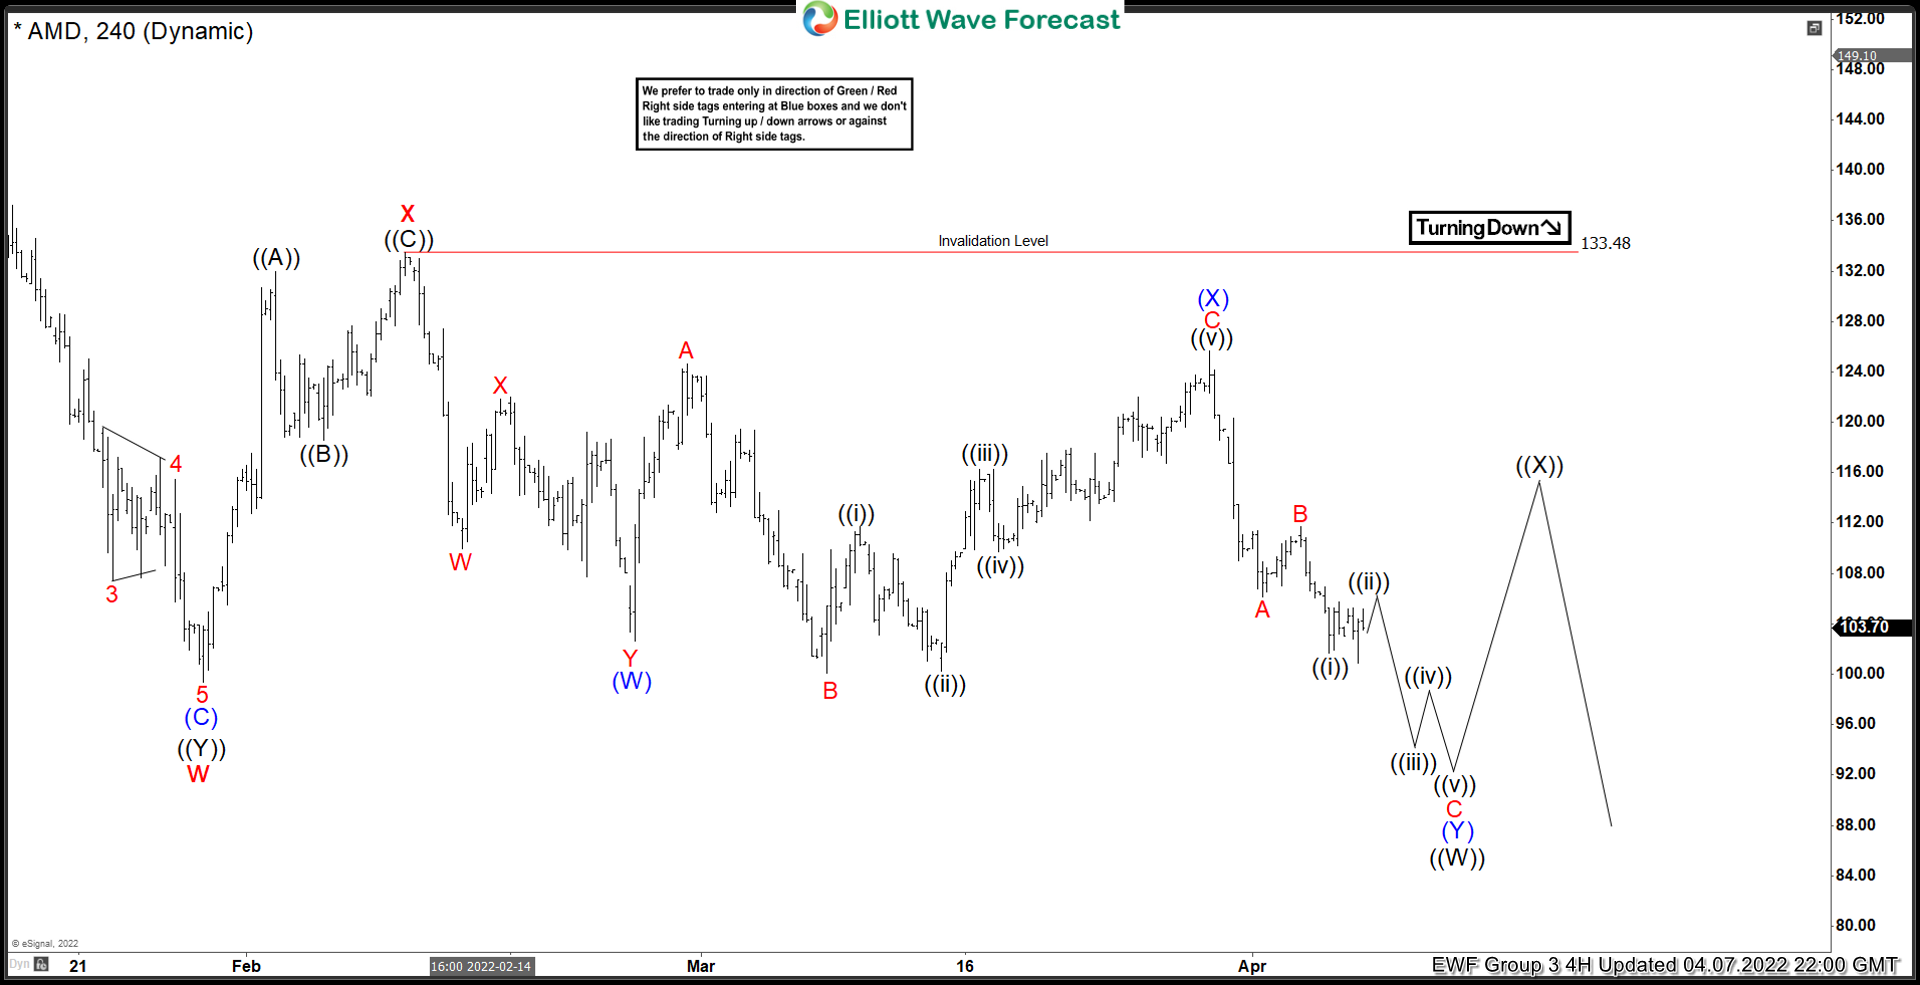
AMD 4h Hour Elliott Wave Analysis 4.7.2022.
133.48 high held nicely and the stock turned lower from 125.04-132.44 area as expected. Correction has completed at 125.73 high as irregular flat pattern. Now, we would like to see further separation down from that high. The price needs to break below previous 01/27 low – W red, to confirm next leg down is in progress. Once that break happens, the stock will become bearish against the 133.48 peak, and it could be offering us some good selling opportunities within a short term cycles.
Keep in mind that market is dynamic and presented view could have changed in the mean time. You can check most recent charts in the membership area of the site. Best instruments to trade are those having incomplete bullish or bearish swings sequences. We put them in Sequence Report and best among them are shown in the Live Trading Room.
Elliott Wave Forecast
Source: https://elliottwave-forecast.com/elliottwave/amd-elliott-wave-decline-flat-pattern/