LTCUSD formed a high at $134.08 on March 30, 2022 and since then it has dropped $23.44 registering a low of $110.64 on April 6, 2022. This translates into a 17.48% decline within a week. Today, we will look at why the rally from February 24, 2022 low stopped where it stopped and how our members were already knew the area and knew where sellers should be appearing. Let’s take a look at some charts of LTCUSD from members area at Elliottwave-Forecast.
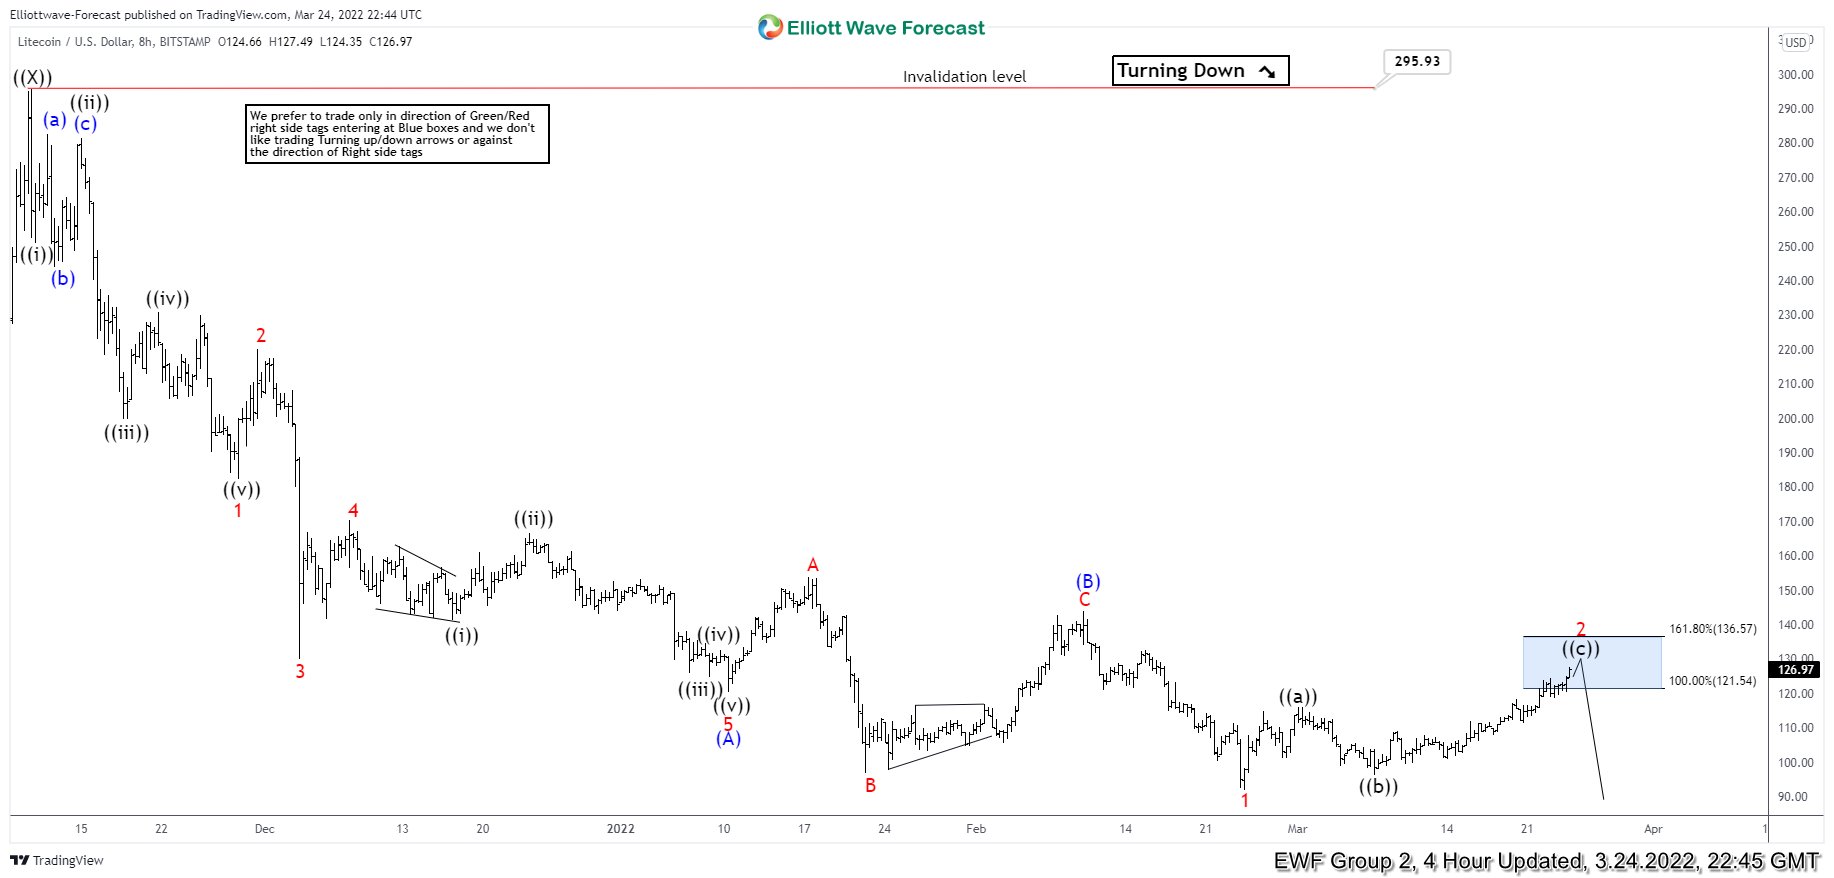
LTCUSD 4 Hour Elliott Wave Analysis – 24 March 2022
Chart below show pair formed a connector wave ((X)) at 295.93 on November 10, 2021. This was followed by a 5 waves impulsive decline to $120.49 reached on January 10, 2022. This was followed by a 3 waves bounce to $153.93 reached on January 17, 2022, then the cryptocurrency dropped to a new below $120.49 and reached a low of $96.85 on January 22, 2022. This drop to new low was in 3 waves and was followed by a sharp 5 waves rally to $144.13 reached on February 10, 2022. After this cryptocurrency resumed the decline and registered a new low at $91.74 on February 24, 2022. This decline was in 5 waves so we called the rally $144.13 as a 3-3-5 running FLAT Elliott wave correction and labelled the drop to $91.74 as wave 1 of the new cycle lower.
LTCUSD started bouncing again with first leg of the bounce ending at $116 on March 1, 2022. This was followed by a pull back to $96.31 reached on March 7, 2022 and then it turned higher again. We highlighted $121.54 – $136.57 as 100 – 161.8% Fibonacci extension area with a blue box and as an area to complete wave 2 corrective bounce. Our members knew wave 2 should end in this area and sellers should appear to resume the decline while price stayed below 161.8% Fibonacci extension level at $136.57 or we should get 3 waves reaction lower at least.

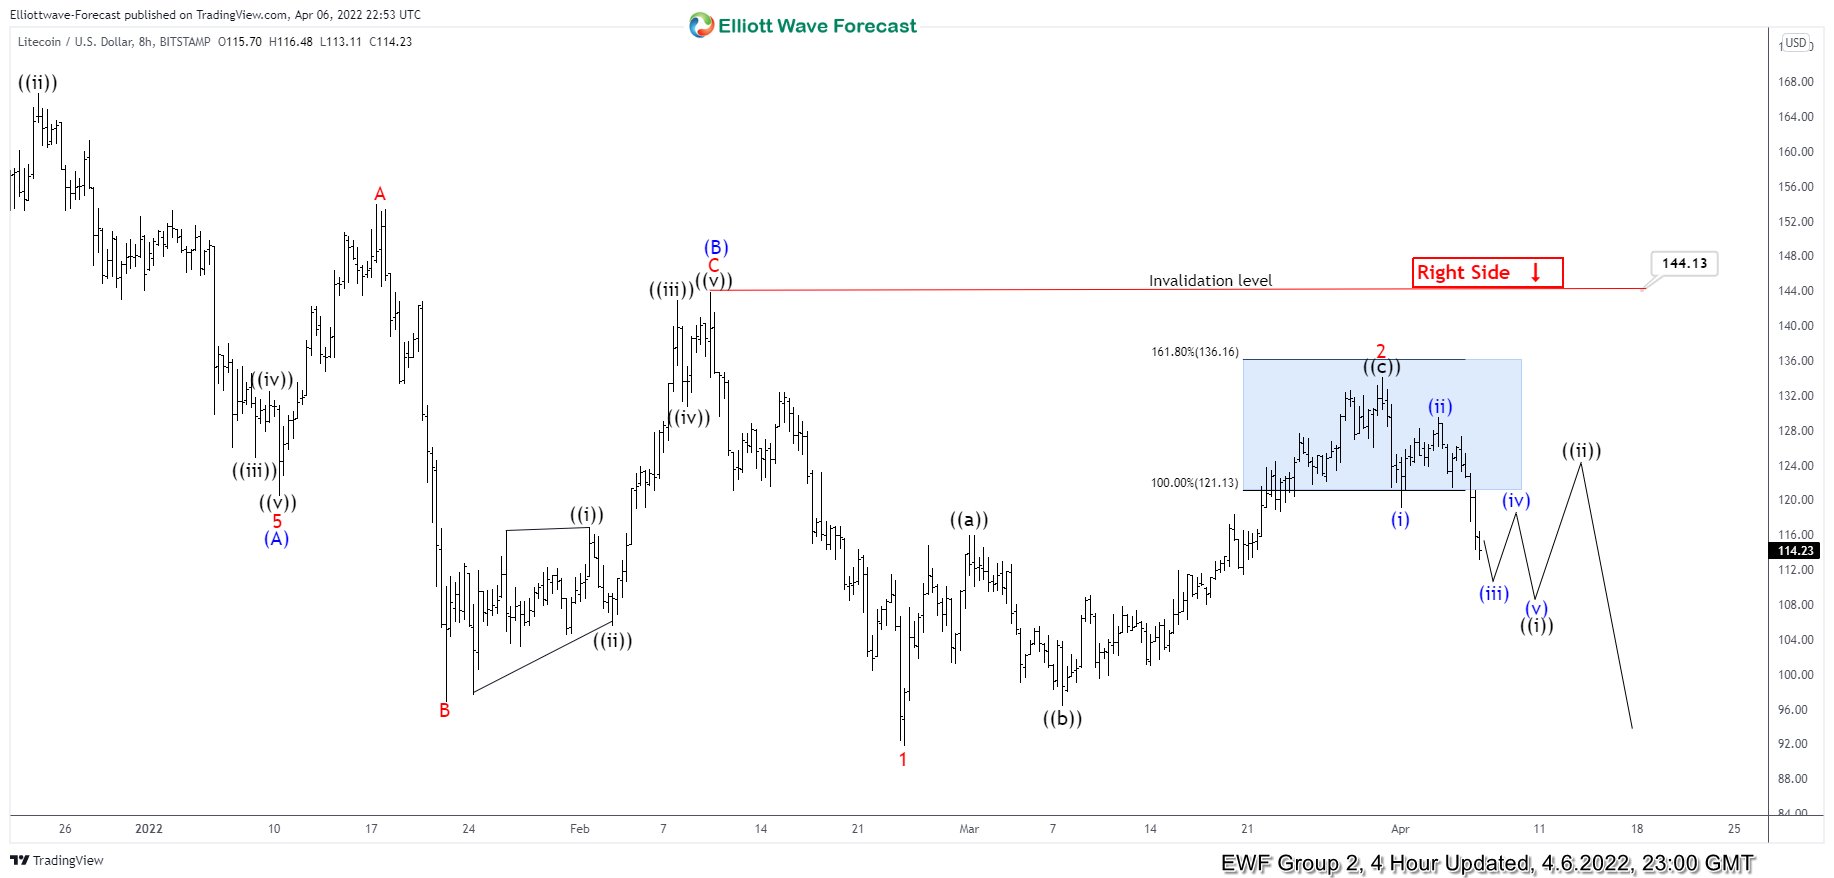
LTCUSD 4 Hour Elliott Wave Analysis – 6 April 2022
Chart below shows sellers did appear in the blue box area and cryptocurrency has turned lower. It has already reached 50% Fibonacci retracement of the rally from ((b)) wave low allowing sellers from blue box to get into a risk free position. Decline from $134.06 high is in 3 waves but while price stays below $129.50 high, it has scope to become 5 waves or 5 swings. Once it manages to complete 5 waves or 5 swings down from $134.06 high, that will add more conviction to the view that decline has resumed and we should get at least 1 more leg down against $134.06 high.

Source: https://elliottwave-forecast.com/trading/ltcusd-selling-rally-blue-box-3-waves-bounce/

