
Unifi Inc. is a global textile solutions provider based in Greensboro, North Carolina, USA. The stock being a component of the Russel3000 index can be traded under ticker $UFI at NYSE. Unifi is one of the world’s leading innovators in manufacturing synthetic and recycled performance fibers. The company is in a possession of proprietary technologies and produces goods for such end markets like apparel, automotive, furnishings, accessories, footwear and many more. Currently, we can see cotton as a basis for the textile industry extending higher. Therefore, Unifi being an important player in the textile market should be a great opportunity for investors to diversify their portfolio by indirect investement in the rising cotton prices.
In the initial article from April 2021, we have called for a new larger cycle higher. The main view remains unchanged. Here, we provide an update and discuss an opportunity for investors to enter the market.
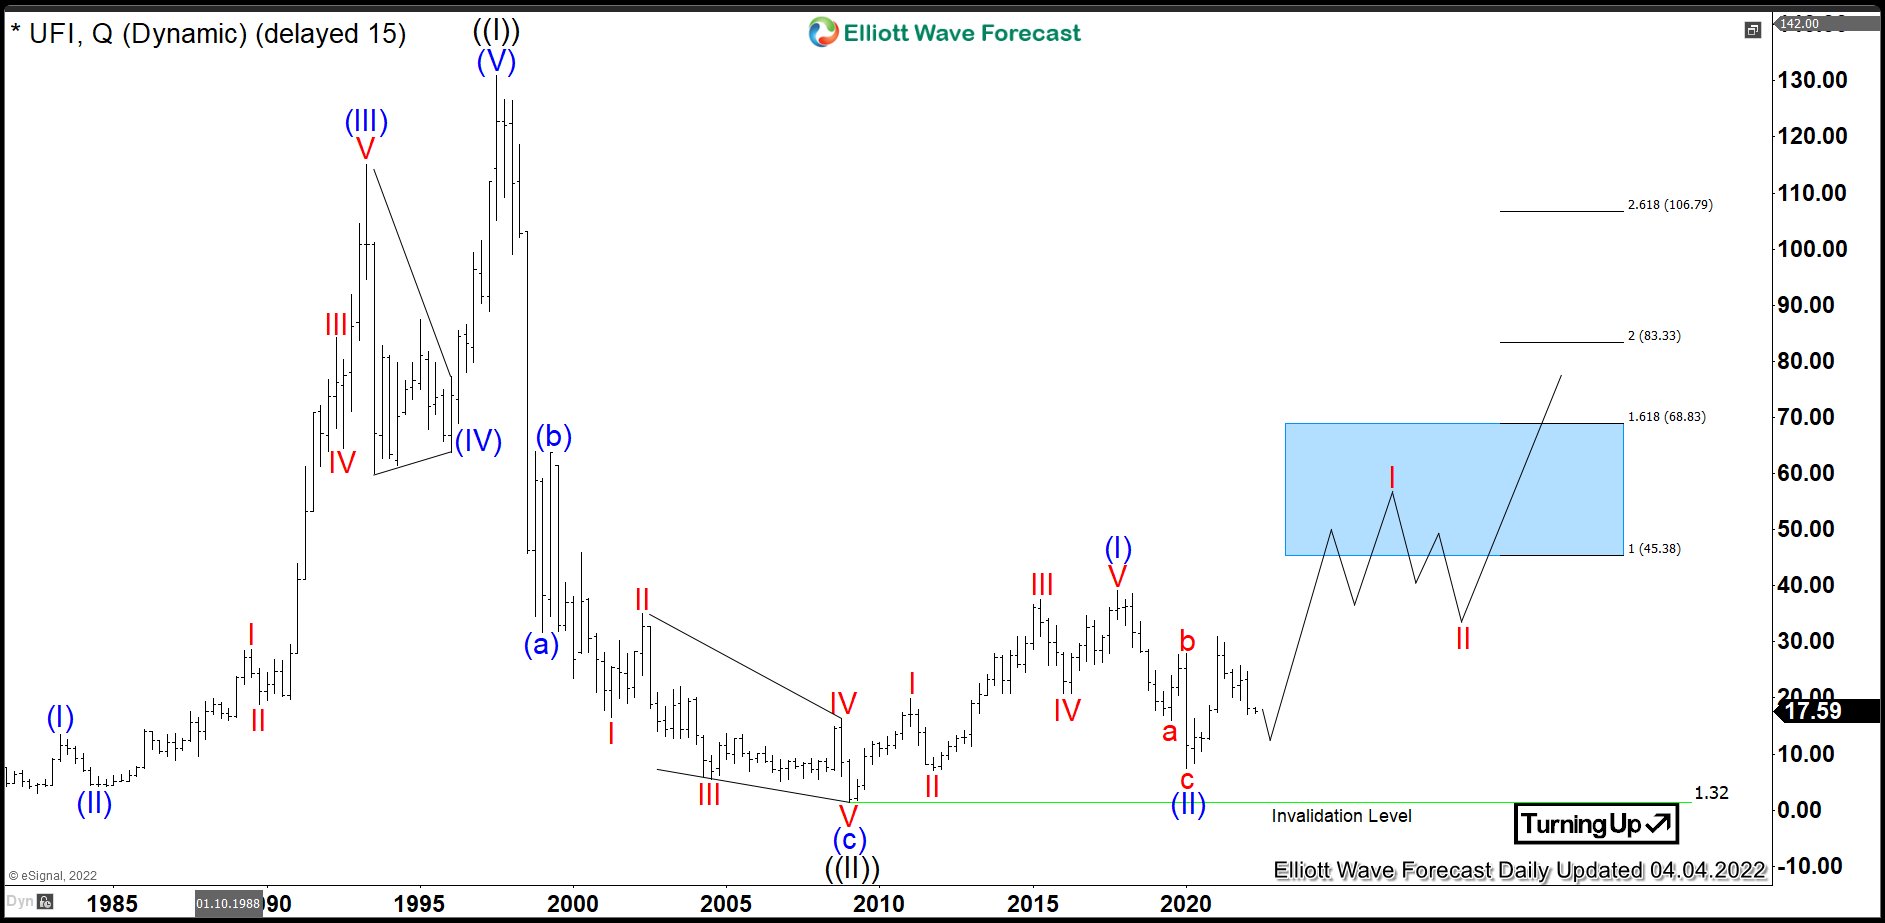
Unifi Quarterly Elliott Wave Analysis 04.04.2022
The Quarterly chart below shows the Unifi shares $UFI traded at NYSE. First, the stock price has developed an impulse higher in black wave ((I)) of grand super cycle degree. It has printed the all-time highs in the 3rd quarter of 1997 at 130.88. From the highs, a correction lower in black wave ((II)) has unfolded as an Elliott wave zigzag pattern. It has printed an important bottom in the 1st quarter of 2009 at 1.32. As a matter of fact, the stock price has lost 99% of its value within 12 years.
From 2009 lows, a new cycle in wave ((III)) has already started and should extend towards 130.88 highs and beyond. Then, the target for wave ((III)) will be towards 132.55-213.62 area and even higher.
From 2009 to 2017, we saw a motive cycle higher in blue wave (I) of black wave ((III)). It has ended at 39.21 highs. From the highs, a correction lower in 3 waves as blue wave (II) has ended in March 2020 at 7.48. Indeed, this can be seen as a first nest within a larger wave ((III)). Now, from the lows, a new cycle in wave (III) of ((III)) may have already started.
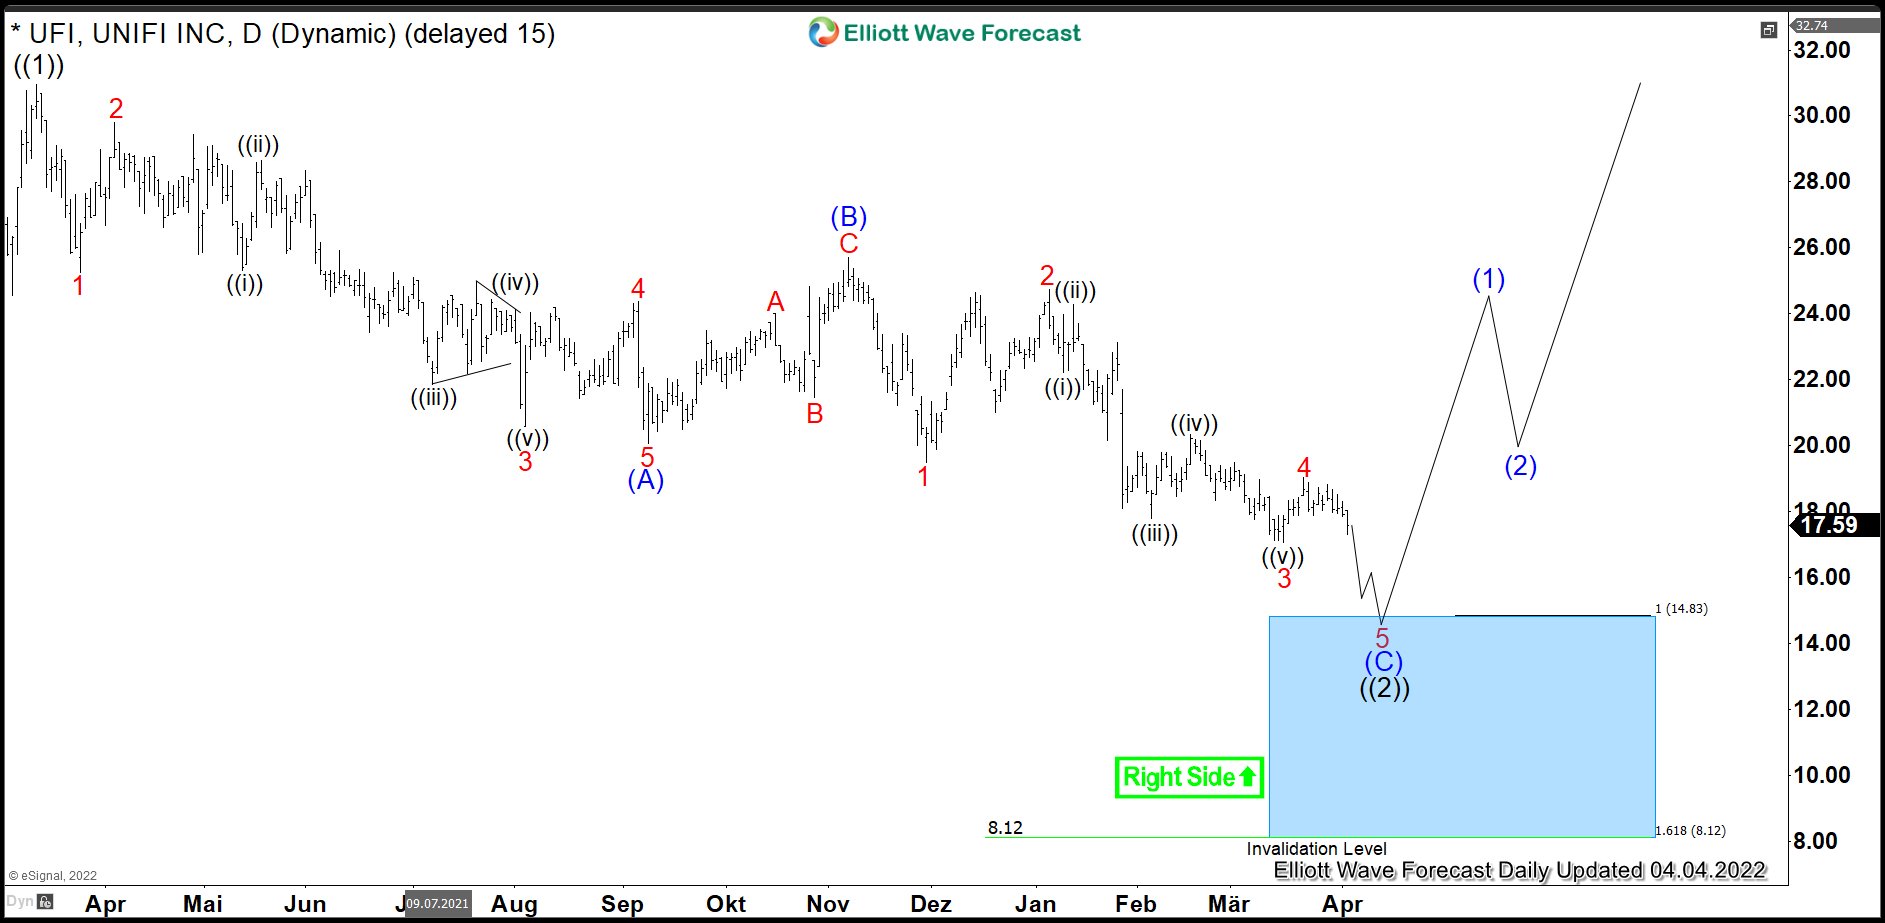
Unifi Daily Elliott Wave Analysis 04.04.2021
The daily chart below shows the correction lower in wave ((2)) in more detail. Hereby, black wave ((2)) corrects the initial cycle up from March 2020 lows within wave ((1)) of I of (III) (not shown). While wave ((1)) is an impulse higher, the consolidation lower is an Elliott wave zigzag pattern being 5-3-5 structure. First, wave (A) of ((2)) ended in September 2021. Then, bounce in wave (B) has printed top in November 2021 at 25.70. Now, while below there, wave (C) should reach towards 14.83-8.12 area. There, a reaction higher in wave ((3)) of I should take place.
Investors and traders can be looking to buy the pullback in wave ((2)) against 7.48 lows from 14.83-8.12 area targeting 45.38-68.83 area and even higher.
Source: https://elliottwave-forecast.com/stock-market/textile-stock-unifi-buying-area/