The Korea Composite Stock Price Index (KOSPI) is the index of all common stocks traded on the Korea Exchange. It is the representative stock market index of South Korea, like the S&P 500 in the United States.
KOSPI Daily Chart March 2022
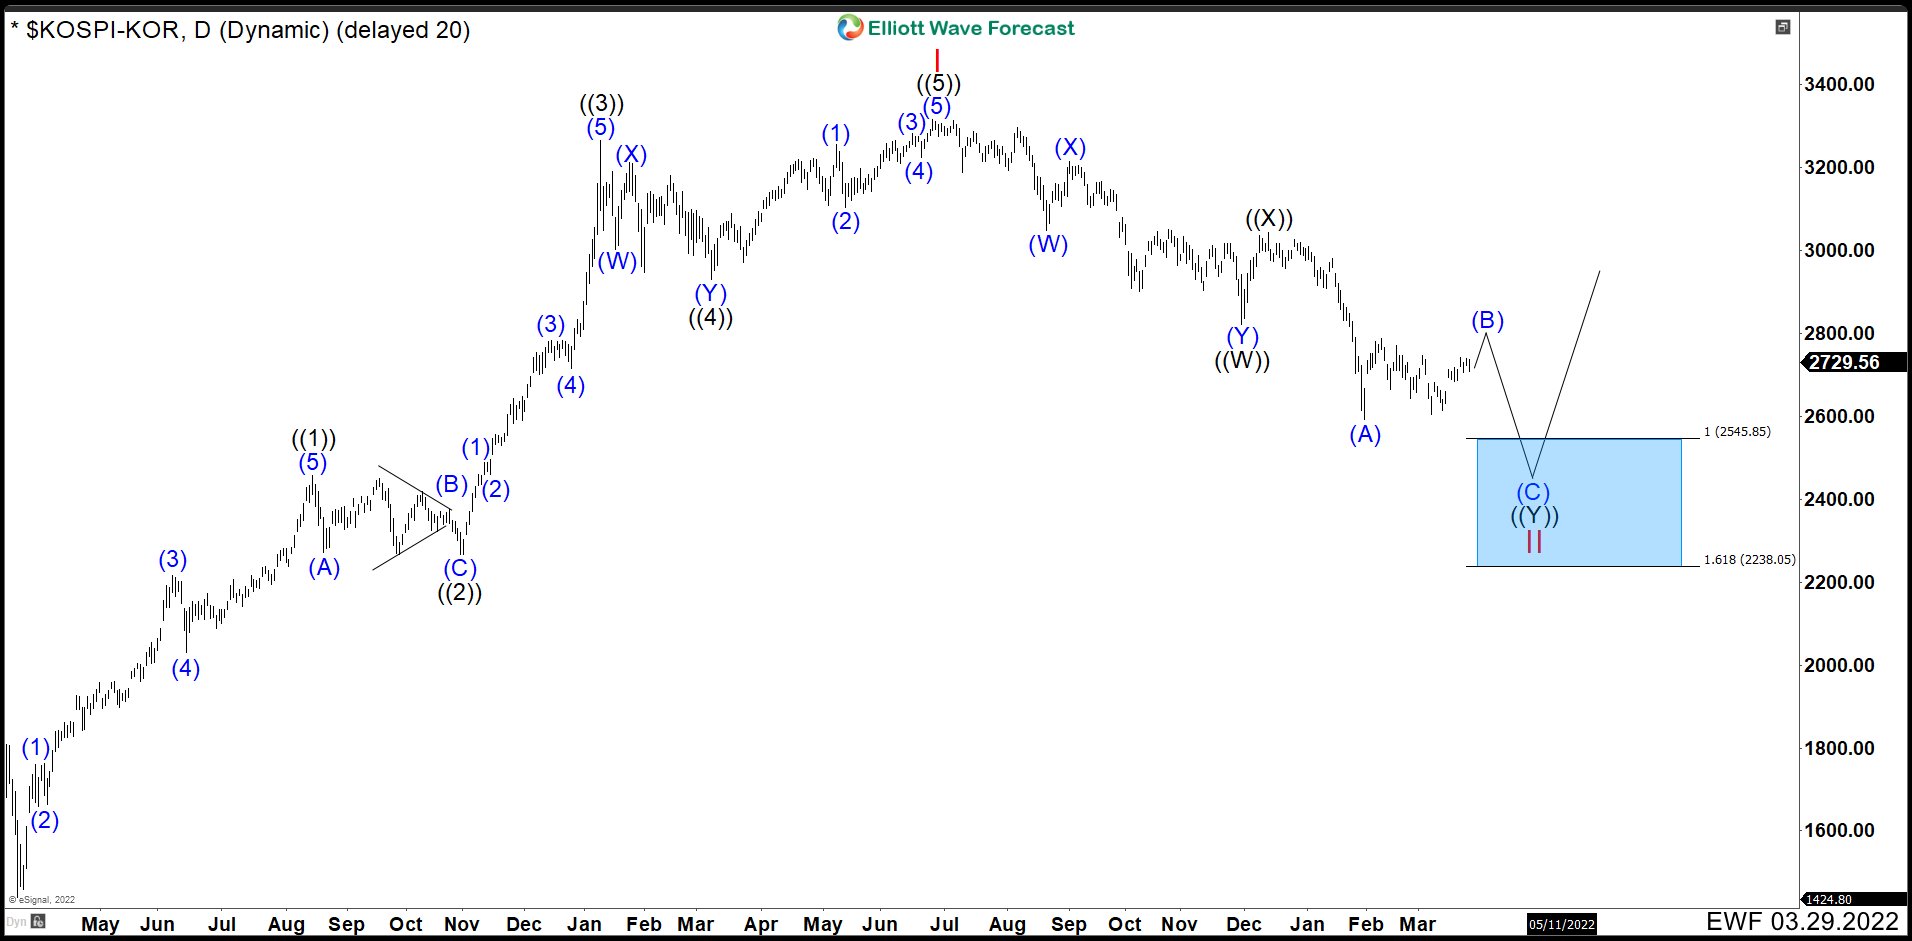
Since March 2020 low, KOSPI began to develop and impulse structure as we can see in the chart. Wave ((1)) ended at 2458.17 and a zig zag correction completed wave ((2)) at 2266.93. Then rally continued finishing wave ((3)) at 3266.23 and a double correction ended wave ((4)) at 2929.36. The last swing built an ending diagonal structure reaching 3316.08 to complete wave ((5)) and wave I. (If you want to learn more about Elliott Wave Theory, follow these links: Elliott Wave Education and Elliott Wave Theory).
In the last days of June 2021, KOSPI began a pullback and this should be a deep one to correct the whole cycle from March 2020. We can count down from the peak 7 swings to build a double correction as wave ((W)) ending at 2822.76. A pullback rally ended the connector wave ((X)) at 3043.83 and continue lower. Currently, we need 3 swings more down to complete wave ((Y)) and wave II. Wave (A) has already finished at 2591.53 and we are developing wave (B). After wave (B) is done, market should break 2592.53 level to confirm wave (C) is under way. KOSPI should look for the blue box in 2545.85 – 2238.05 area to end the whole pullback of March 2020 and wave II to continue with the rally.
Source: https://elliottwave-forecast.com/stock-market/south-korean-index-kospi-near-support/