
The Goldman Sachs Group, Inc. (GS) is an American multinational investment bank and financial services company headquartered in New York City. It offers services in investment management, securities, asset management, prime brokerage, and securities underwriting.
GS OCTOBER 2021 DAILY CHART
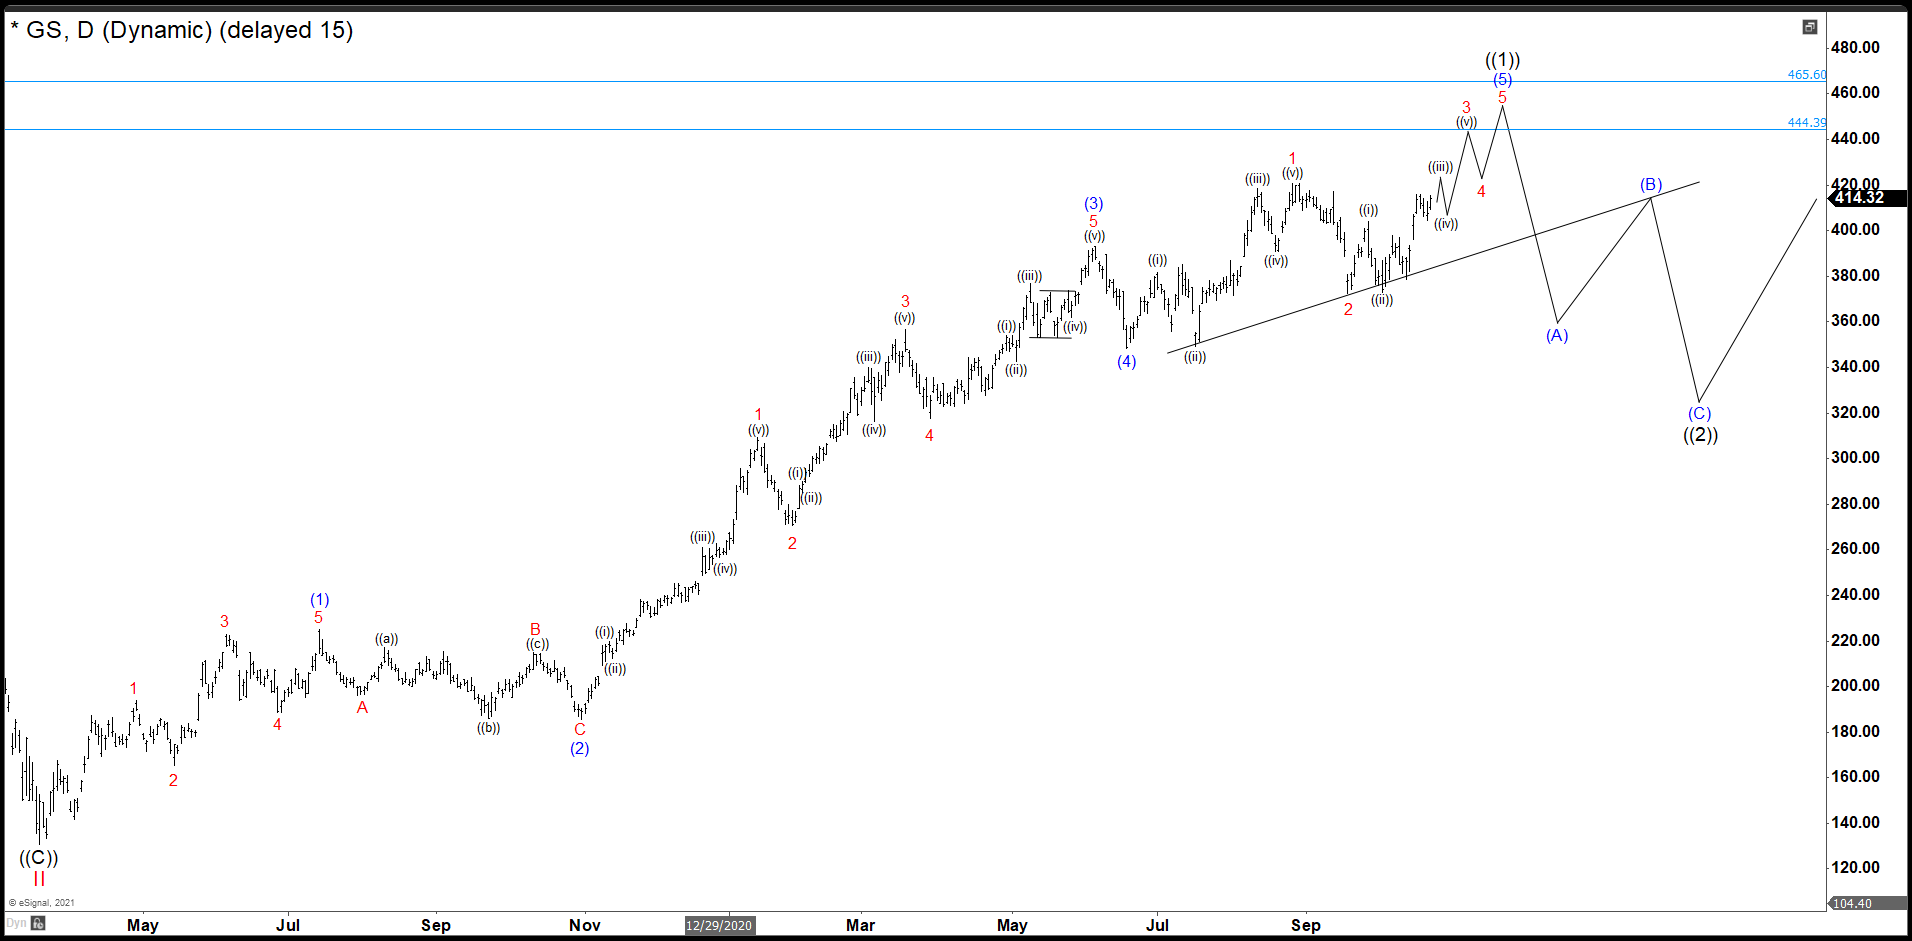
Last October, we were looking to complete an impulse from March 2020 low. The first wave of impulse that we called wave (1) ended at 225.24 dollars. Pullback as wave (2) ended at 185.52. Then the stock rally creating 5 swings up in lesser degree to form wave (3) completed at 393.26. Wave (4) correction finished at 348.13 and from here last rally ended at 426.16 without reaching our minimum target 444.39. GS drawn an ending diagonal structure to complete wave (5) and the impulse wave ((1)). (If you want to learn more about Elliott Wave Theory, please follow these links: Elliott Wave Education and Elliott Wave Theory).
GS FEBRUARY DAILY CHART
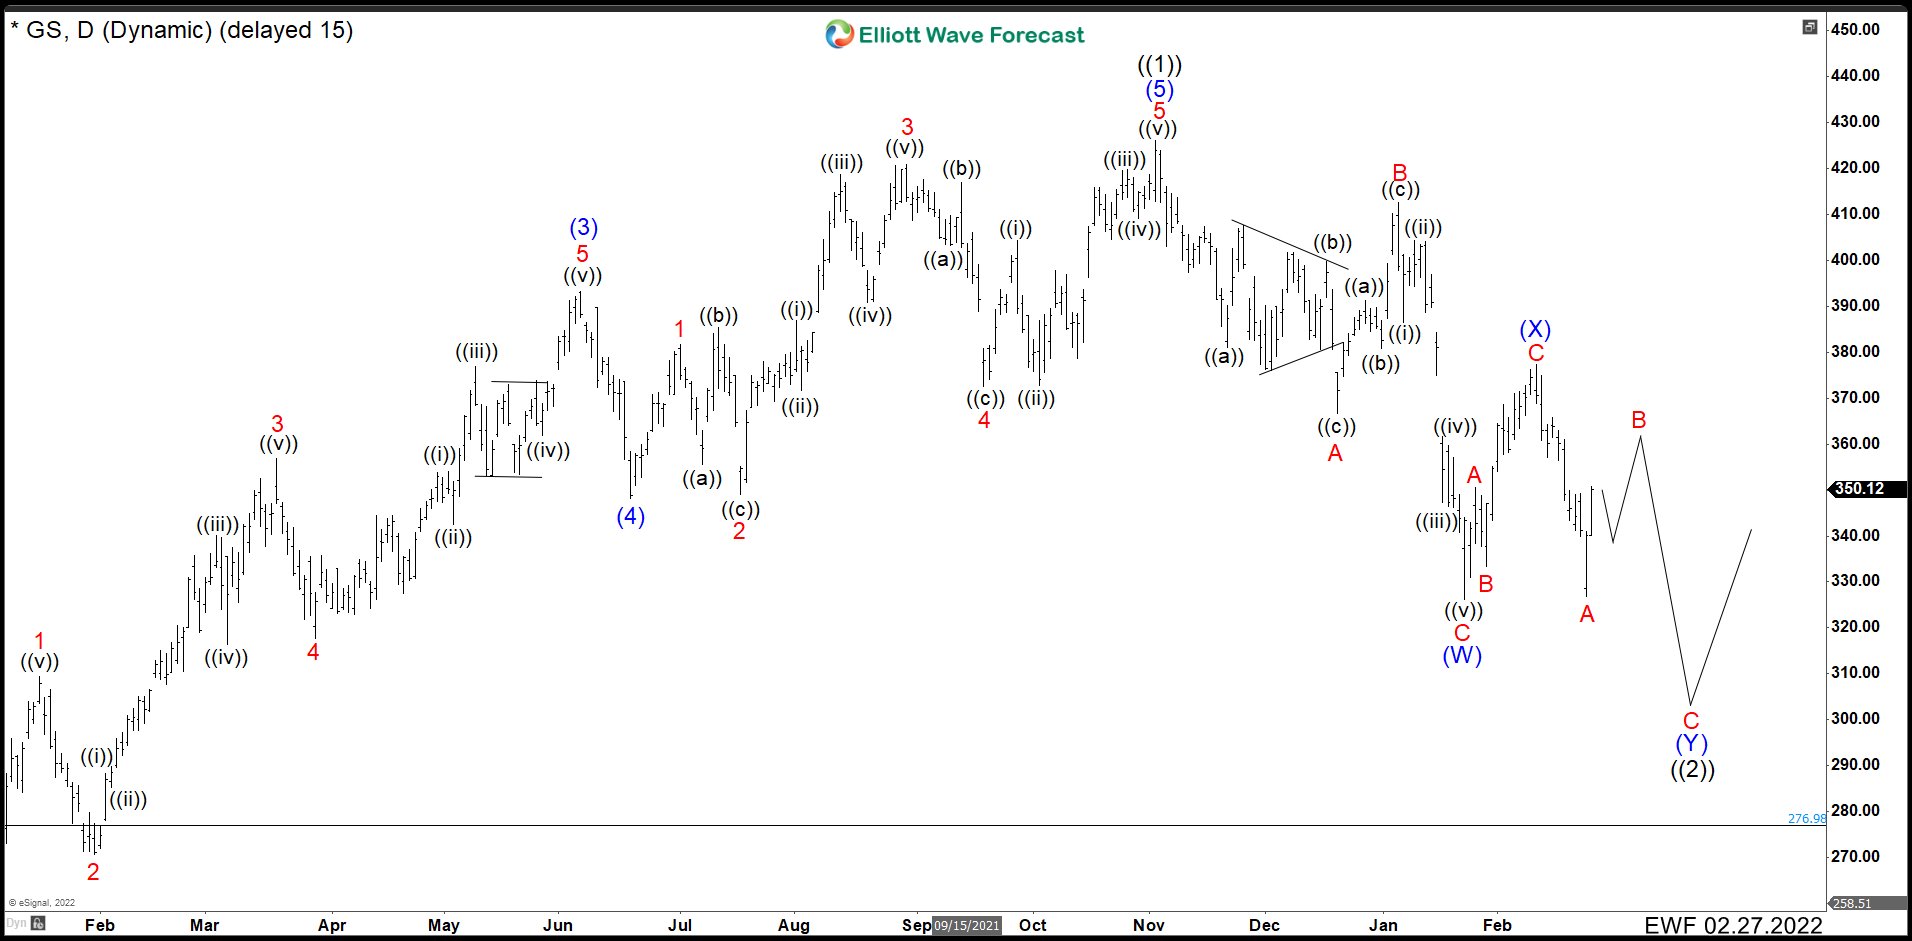
From the peak, GS fell in 3 swings to end wave A at 366.65. Then 3 swings up to complete wave B at 412.66 and an impulse dropped to finish a flat correction. As we have already drawn 3 swings correction, we can perfectly continue with the rally from here. However, given the market conditions we are calling a double correction. Therefore, we are labeling 326.23 low as (W), bounce to 377.40 as wave (X). This Elliott structure needs 3 swings down more, a simple ABC, to complete it. Wave A is done already at 326.95 and currently we are developing wave B and after ending this wave we should see further bearish movement. The target to complete this correction and wave ((2)) we are considering 305.00 – 277.00 area. The view is valid as we stay below 377.40.
Source: https://elliottwave-forecast.com/stock-market/possible-goldman-sachs-gs-falling/