
In this technical blog, we will look at the past performance of 4 hour Elliott Wave Charts of Nvidia stock ticker symbol: NVDA. In which, the rally from 08 March 2021 low ended wave (III) in an impulse structure & made a pullback in wave (IV). Therefore, we knew that the structure is incomplete to the upside. And another push higher minimum should happen to complete the 5 wave advance. So, we advised members not to sell the stock & buy the dips in 3, 7, or 11 swings at the blue box areas. We will explain the structure & forecast below:
NVDA 4 Hour Elliott Wave Chart
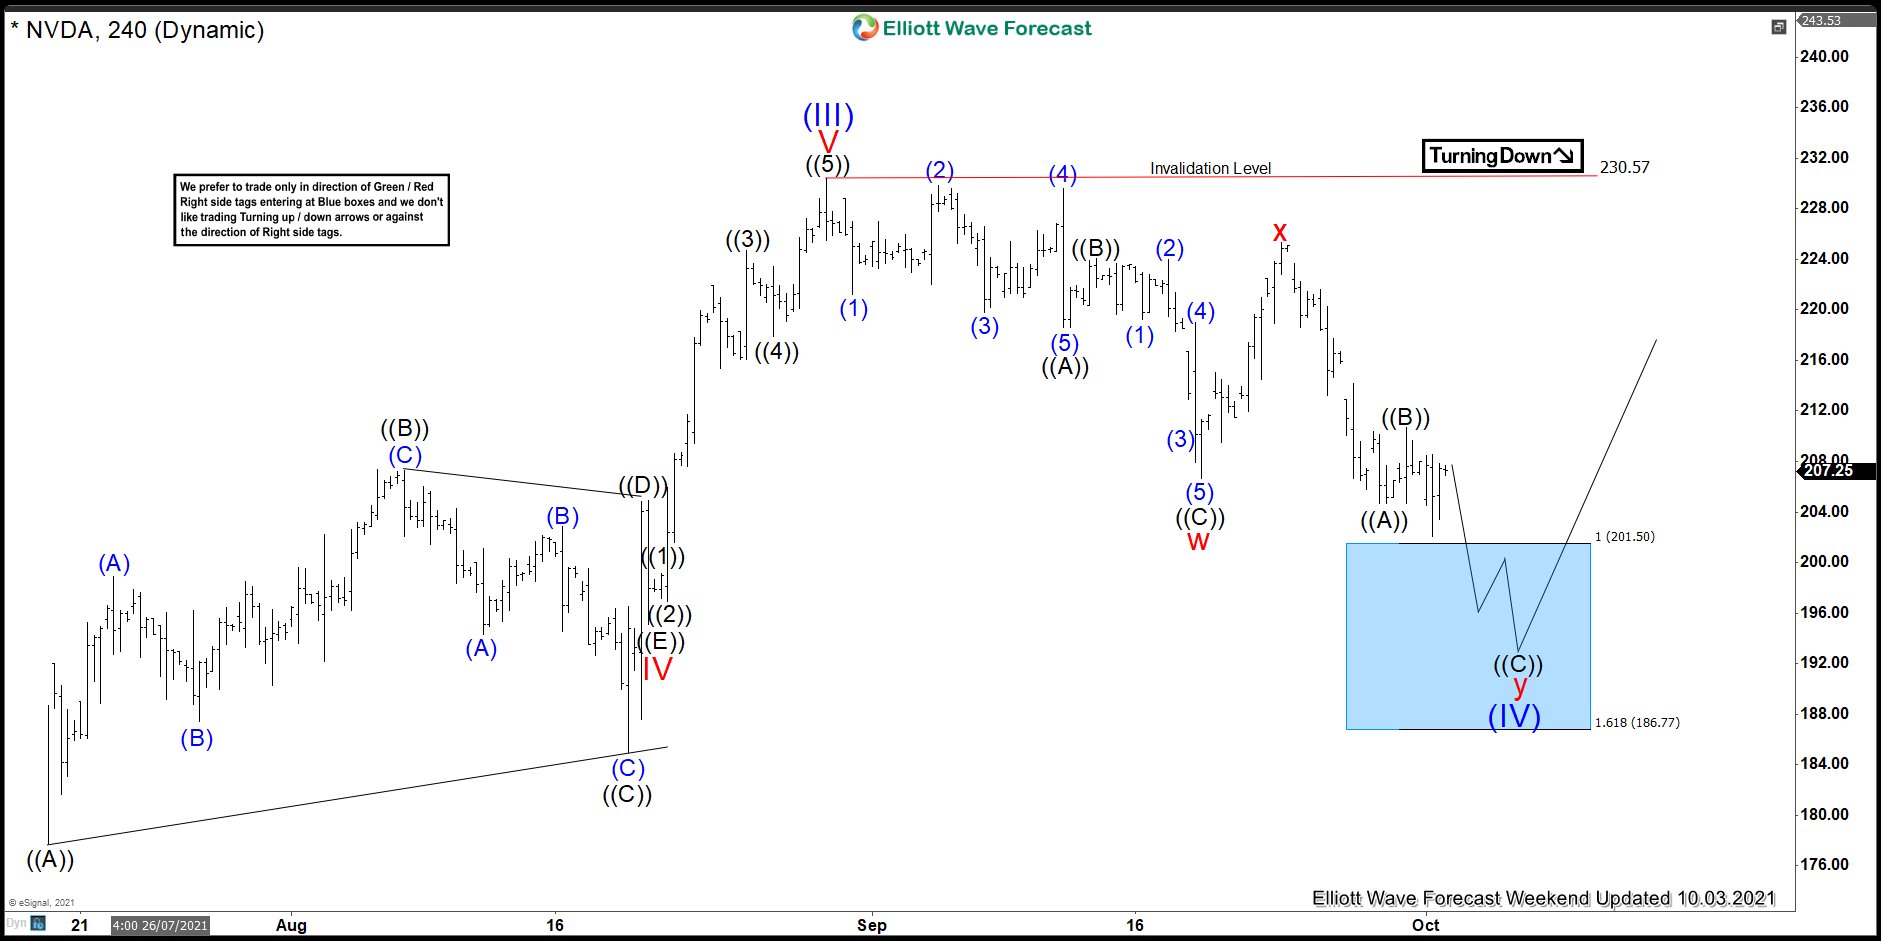
Here’s 4hr Elliott Wave Chart of NVDA from the 10/03/2021 Weekend update. In which, the rally to $230.57 high ended wave (III) & made a pullback in wave (IV). The internals of that pullback unfolded as Elliott wave double three structure where wave w ended at $206.62 low. Wave x bounce ended at $225.35 high and wave y was expected to reach $201.50- $186.77 blue box area. From their buyers were expected to appear looking for new highs ideally or for a 3 wave bounce minimum.
NVDA Latest 4hr Elliott Wave Chart
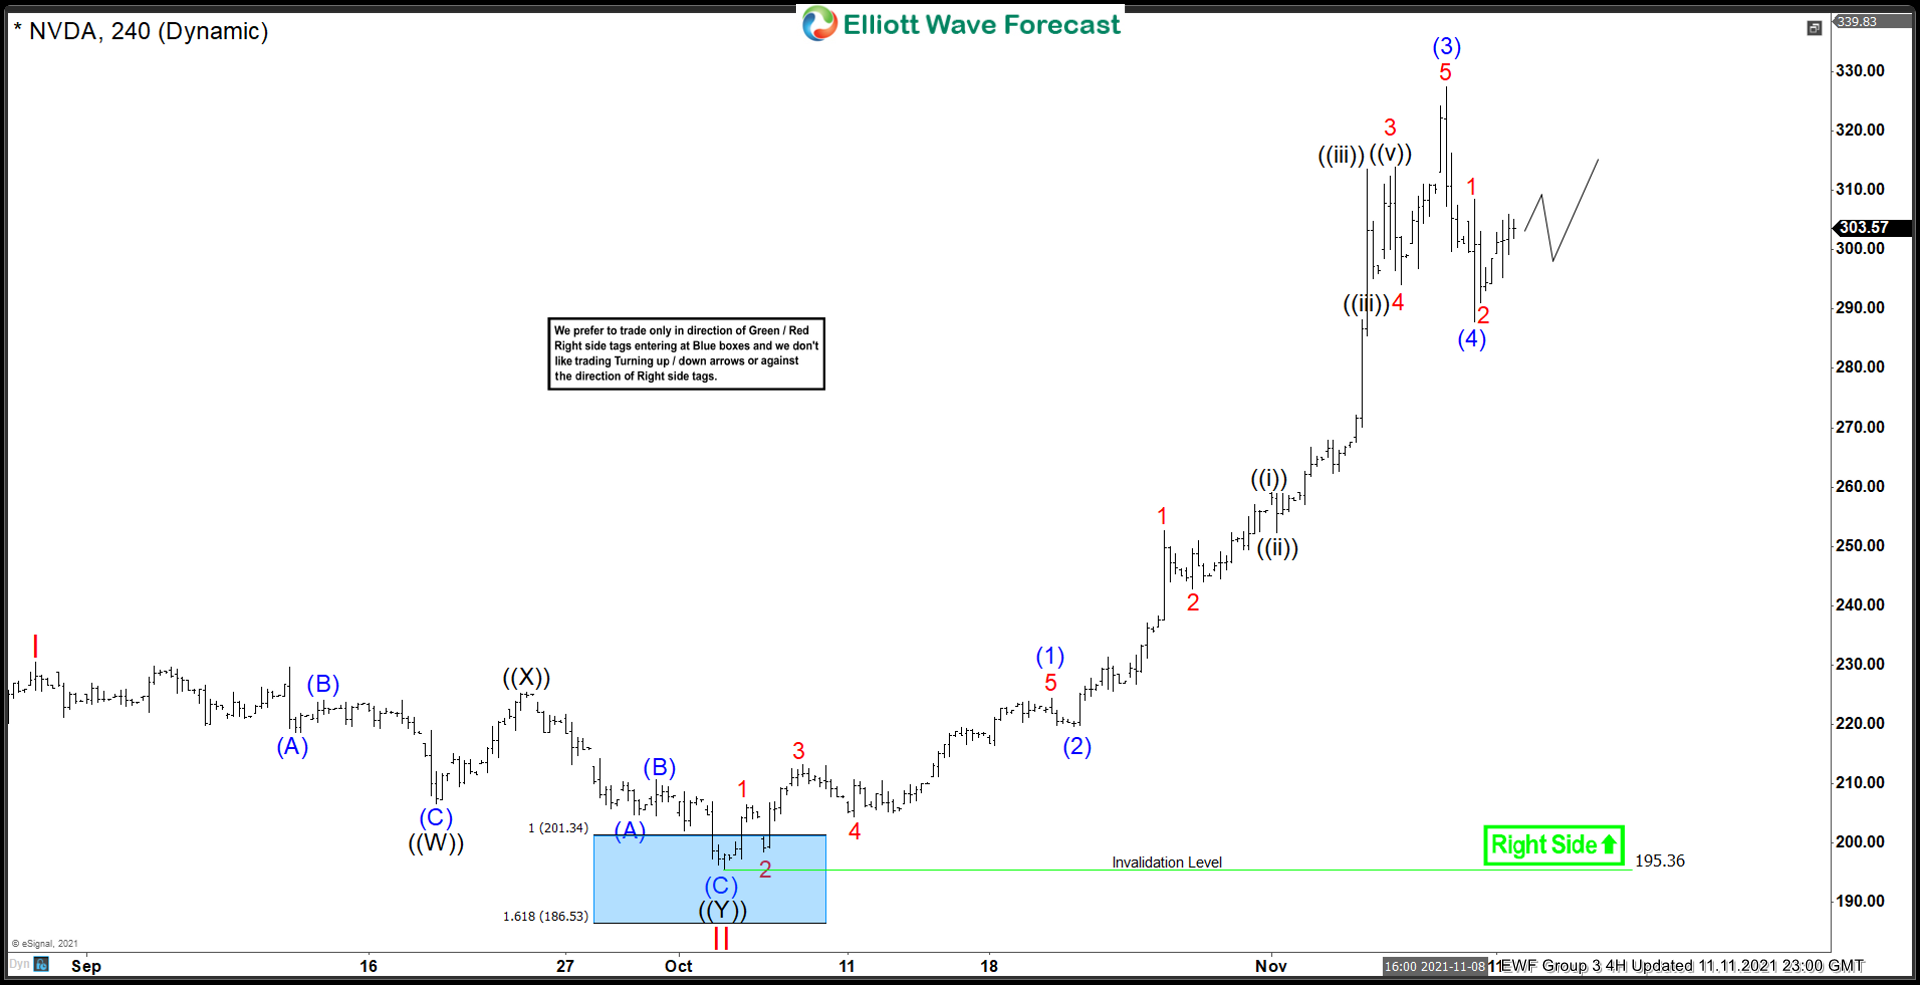
This is the latest 4hr Elliott wave Chart of NVDA from the 11/11/2021 update. In which the ETF is showing a strong reaction higher taking place from the blue box area at $201.50- $186.77. Right after ending the double three correction within the blue box area. Allowed members to create a risk-free position shortly after taking the long positions at the blue box area. However, it’s important to note that with further data, we were able to adjust the degree of the structure as a nest in wave (III).
Source: https://elliottwave-forecast.com/stock-market/nvda-made-new-time-highs-blue-box-area/