
In this technical blog, we will look at the past performance of 4 hour Elliott Wave Charts of Technology ETF ticker symbol: $XLK. In which, the rally from 05 March 2021 low ended wave (3) in an impulse structure & made a pullback in wave (4). Therefore, we knew that the structure in XLK is incomplete to the upside. And another push higher should happen to complete the 5 wave advance from 21 September 2020 low. So, we advised members not to sell the ETF & buy the dips in 3, 7, or 11 swings at the blue box areas. We will explain the structure & forecast below:
XLK 4 Hour Elliott Wave Chart
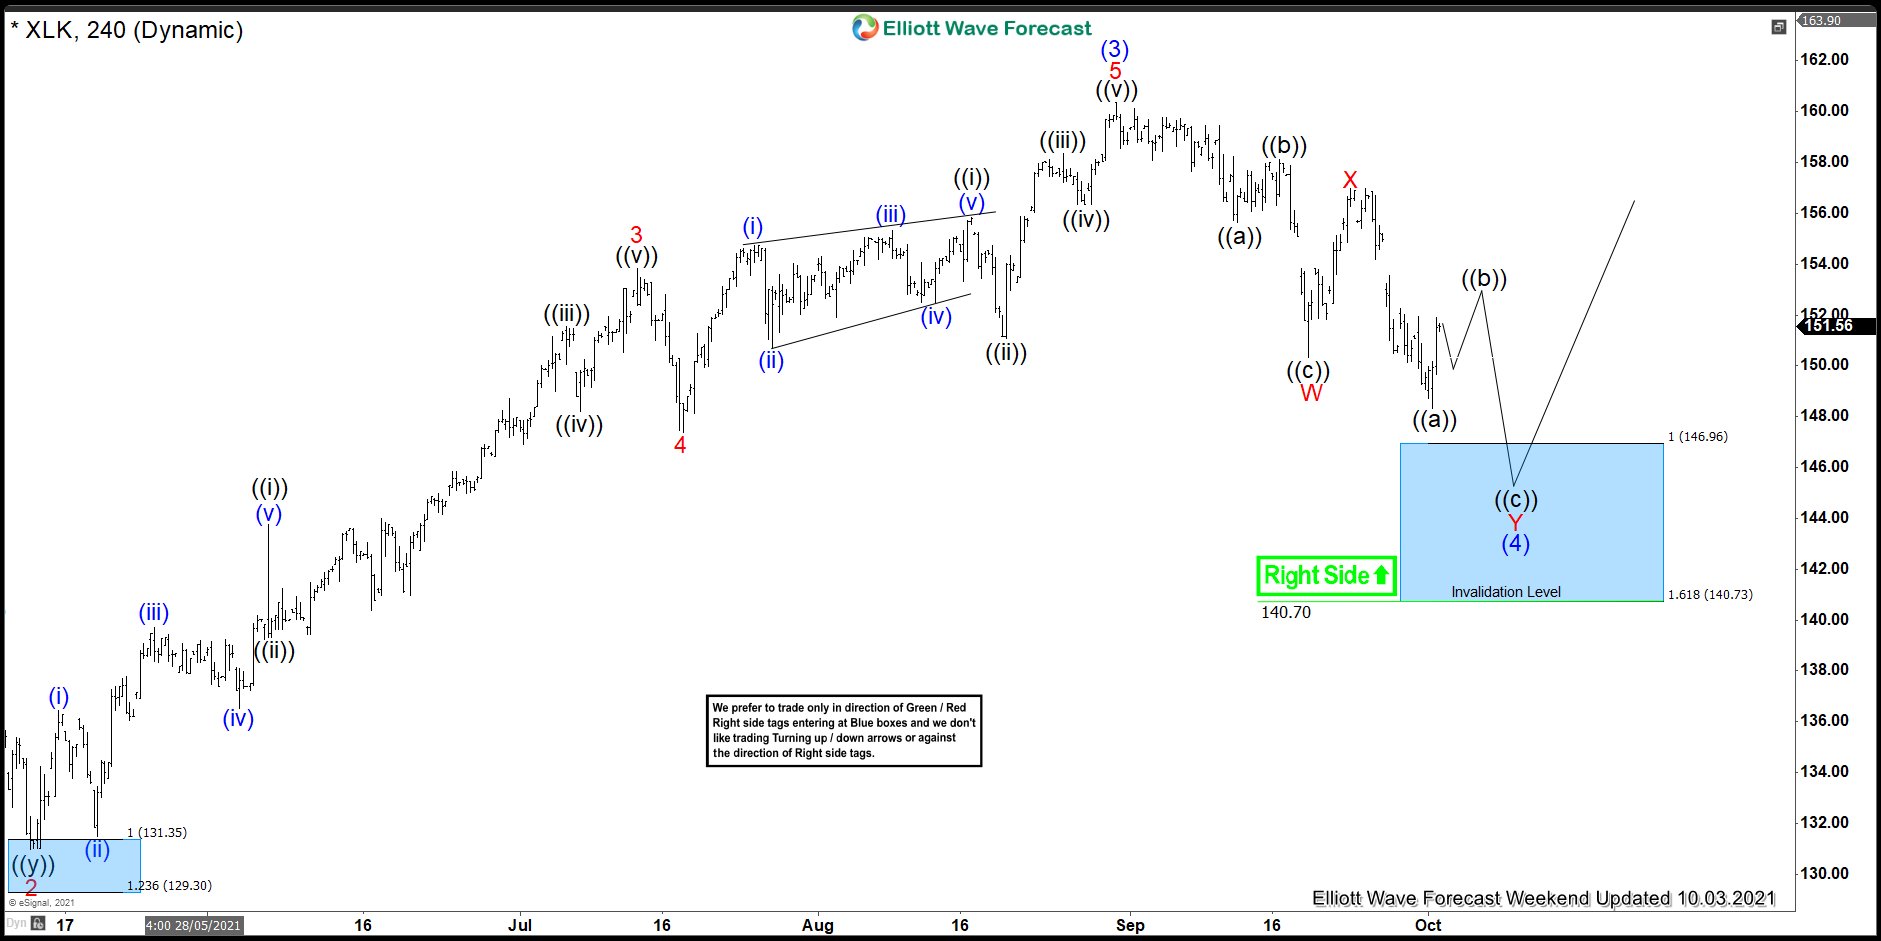
Here’s 4hr Elliott Wave Chart of XLK from the 10/03/2021 Weekend update. In which, the rally to $160.36 high ended wave (3) & made a wave (4) pullback. The internals of that pullback unfolded as Elliott wave double three structure where wave W ended at $150.35 low. Wave X bounce ended at $156.97 high and wave Y was expected to reach $146.96- $140.73 blue box area. From where buyers were expected to appear looking for new highs ideally or for a 3 wave bounce minimum.
XLK Latest 4hr Elliott Wave Chart

This is the latest 4hr Elliott wave Chart from the 11/03/2021 update. In which the ETF is showing a strong reaction higher taking place from the blue box area at $146.96- $140.73. Right after ending the double three corrections within the blue box area. Allowed members to create a risk-free position shortly after taking the long positions at the blue box area.
Source: https://elliottwave-forecast.com/stock-market/xlk-forecasting-bounce-higher/