
The Swiss Market Index (SMI) is one of the other Capital Markets worldwide that is building motive wave from the lows of March 2020. We can clearly see that it has already completed 3 waves to the upside and we are correcting on wave 4 now.
SMI Old Daily Chart
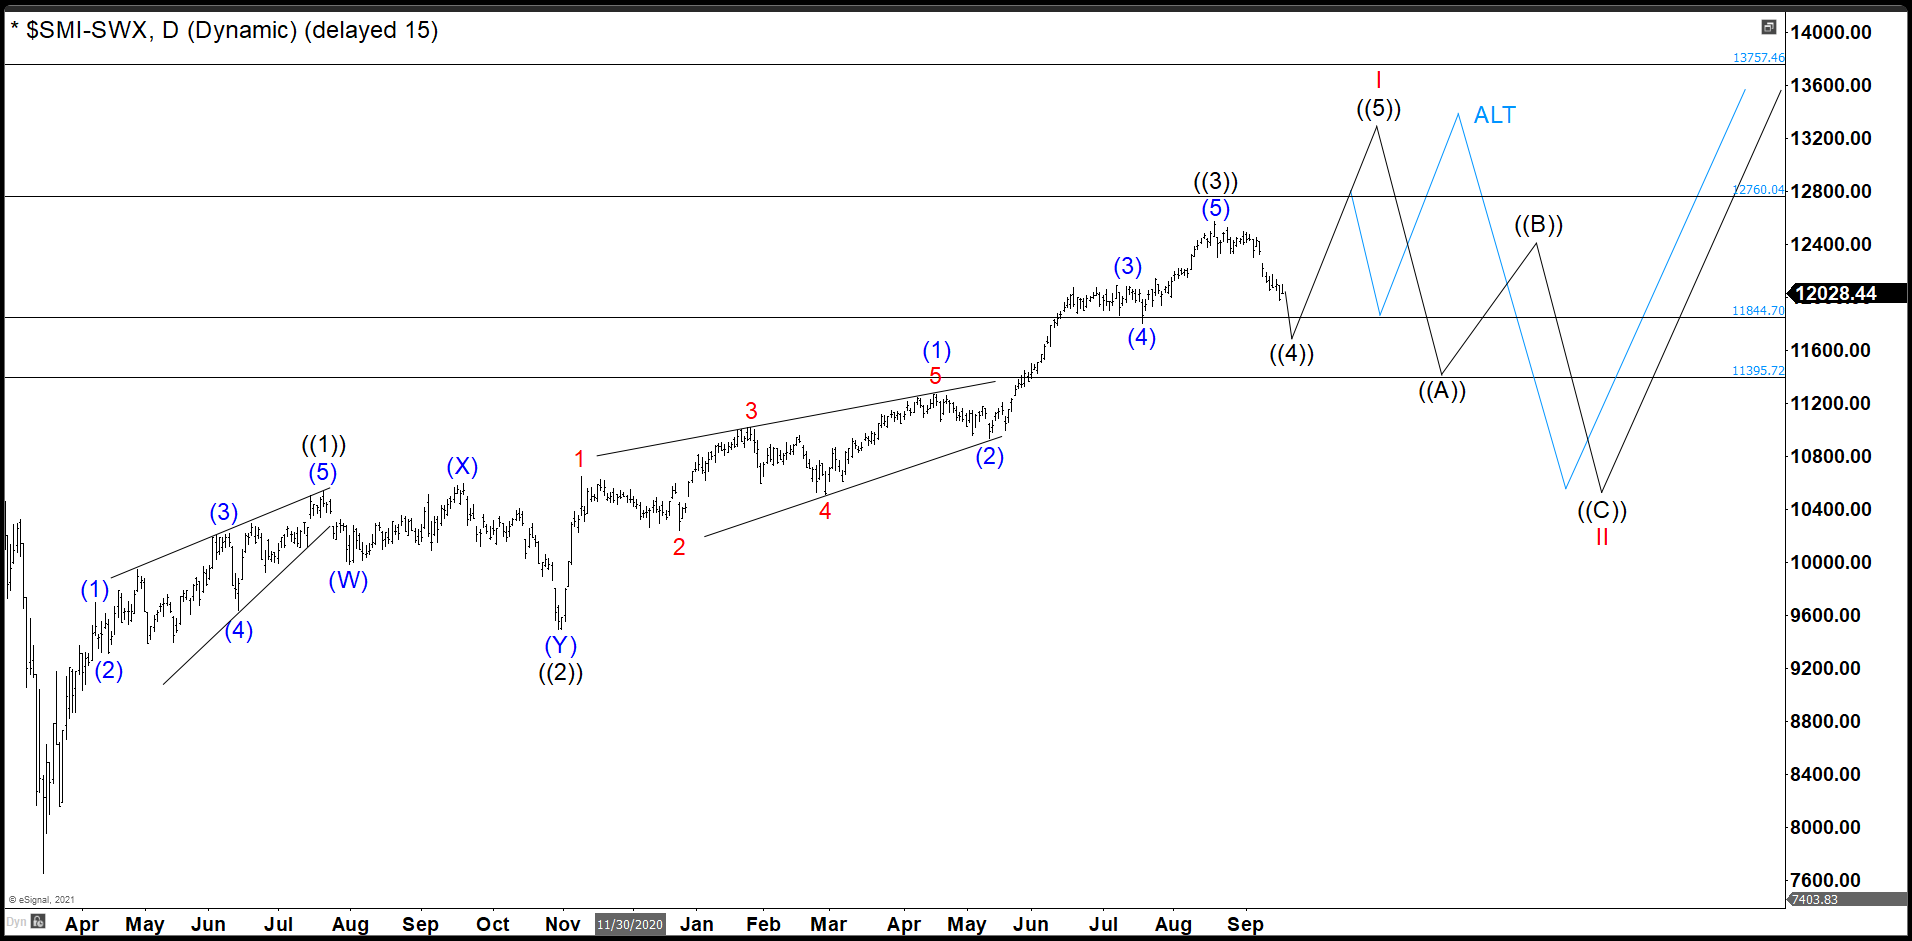
Chart from September 16th, Wave ((1)) ends at 10534 as leading diagonal. Wave ((2)) did a ouble correction to complete at 9498. Then the SMI bounce from there developed another impulse as wave ((3)). The wave (1) of ((3)) did another leading diagonal. If you want to learn more about Elliott Wave Theory, please follow this link: Elliott Wave Theory). Then wave (2) of ((3)) was short ending at 10922. Wave (3) of ((3)) impulse ends at 12088 and wave (4) of ((3)) pullback at 11800. Last push to complete wave (5) of ((3)) and wave ((3)) peak at 12582.
SMI Daily Chart
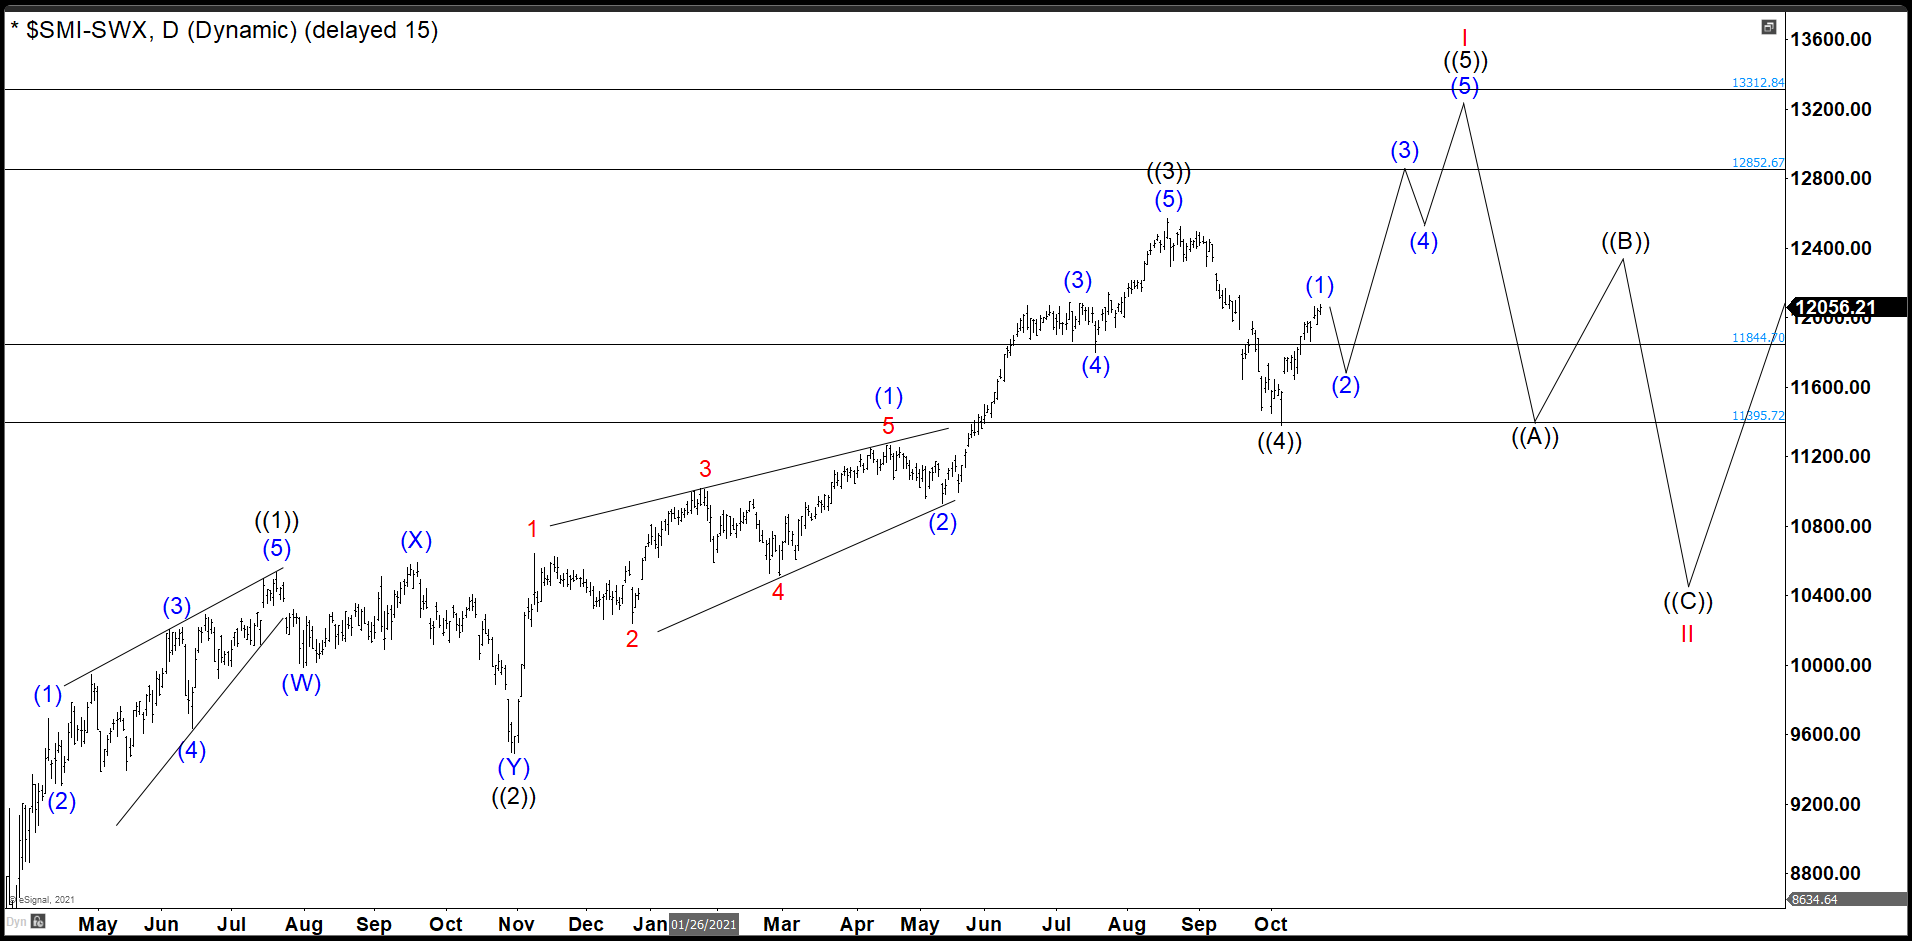
The SMI continued dropping as expected ended wave ((4)) at 11381.74, a little below from our buying area. 11844 – 11395. Index bounced nicely and it should complete wave (1) soon. The pullback as wave (2) must stay above of 11381.74 level to validate this view.
With this structure, the last swing should end in 12852 – 13312 area where wave I of upper degree will end and we should correct the whole cycle in wave II.
Source: https://elliottwave-forecast.com/stock-market/smi-ended-wave-4-looking-push-higher/