All stocks tried to recover what they lost and Berkshire Hathaway was not exception since the crash of March 2020. BRK.B did not only recover the lost, but It also reached historic highs. Now, it is building an impulse from March 2020 lows and we are going to follow to determinate the best area to complete the impulse.
Berkshire Hathaway Old Daily Chart
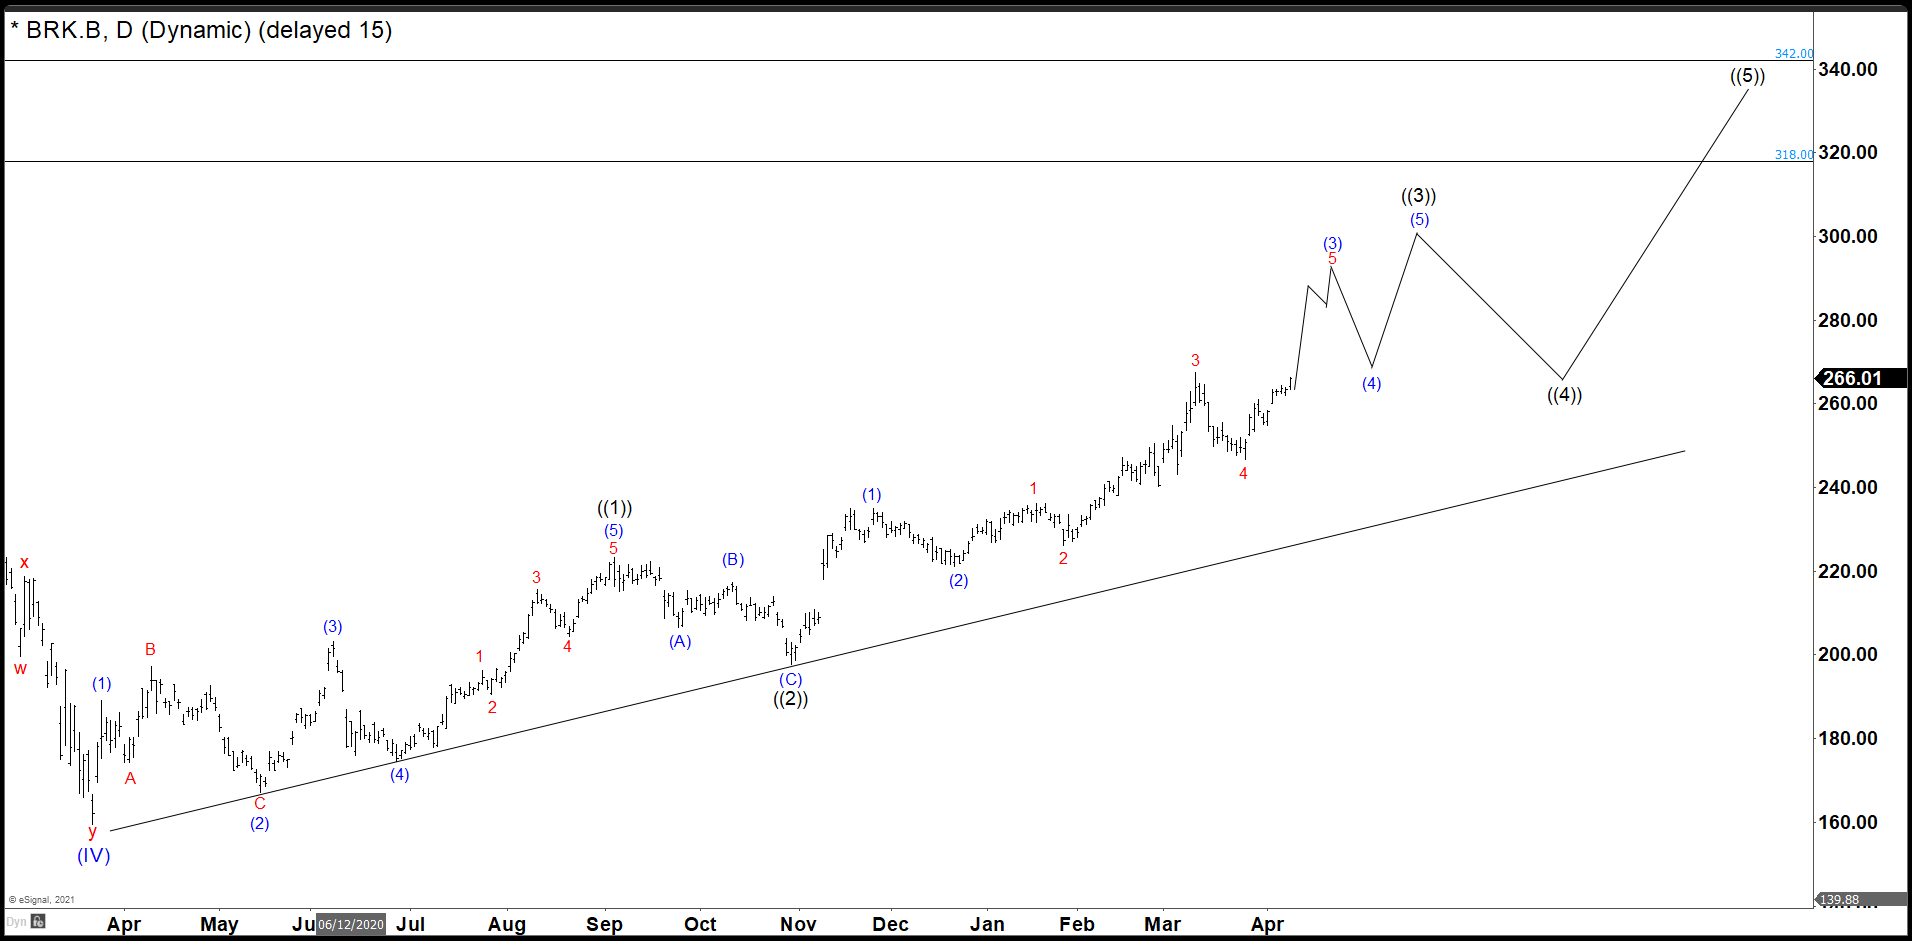
As we see in this daily chart from April, The wave ((1)) ended and the structure could be rare for you because it is not quite common, and it is called an expanding leading diagonal. (If you want to learn more about Elliott Wave Theory, please follow this link: Elliott Wave Theory). I think it is better to manage the structure of Berkshire Hathaway in that way instead of a nest, and this is because comparing some cycles in the market has more sense with the current structures of the market. Then we have a clear (A), (B), (C) correction as wave ((2)) and we called the continuation of wave ((3)) to the upside.
Berkshire Hathaway Old Daily Chart
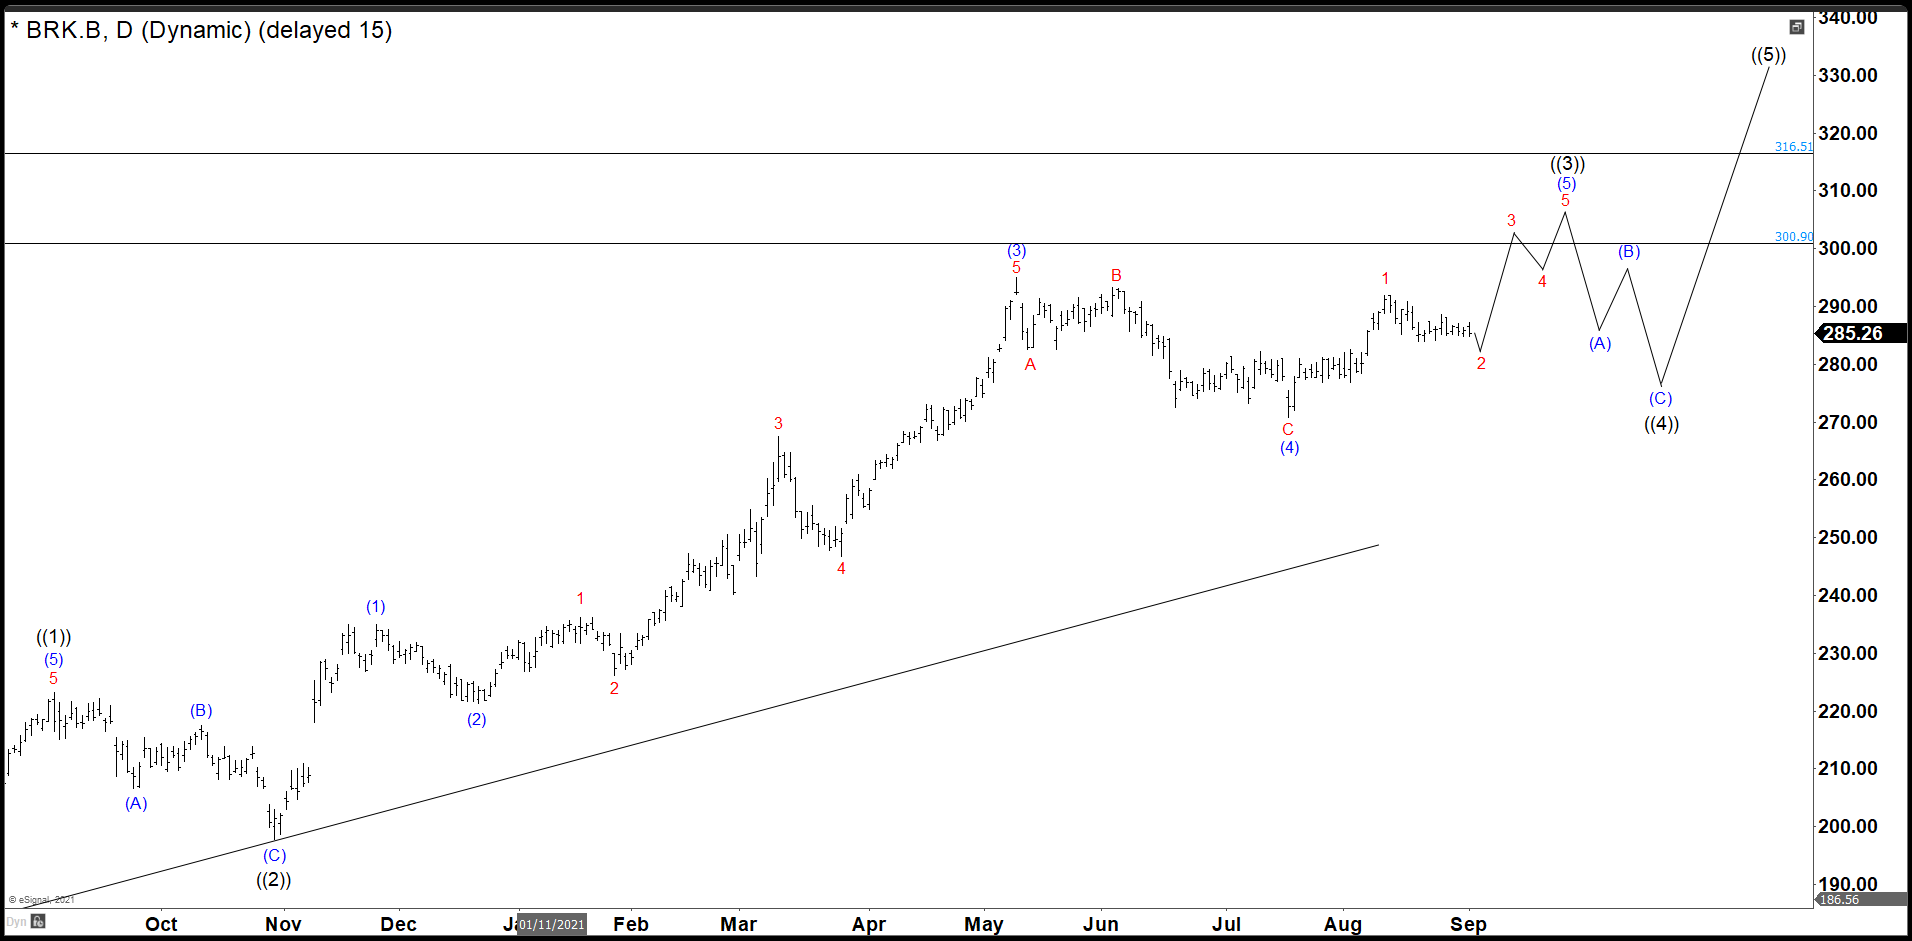
In this daily chart from beginning of September, we were calling one more high to complete wave ((3)); but after a month, the Berkshire Hathaway’s share entered in a ranging stage and it has consumed a lot of time to think that the structure from wave (3) in blue peak it is more likely that is the wave ((4)) of the impulse and we changed the labelling of the chart.
Berkshire Hathaway Daily Chart
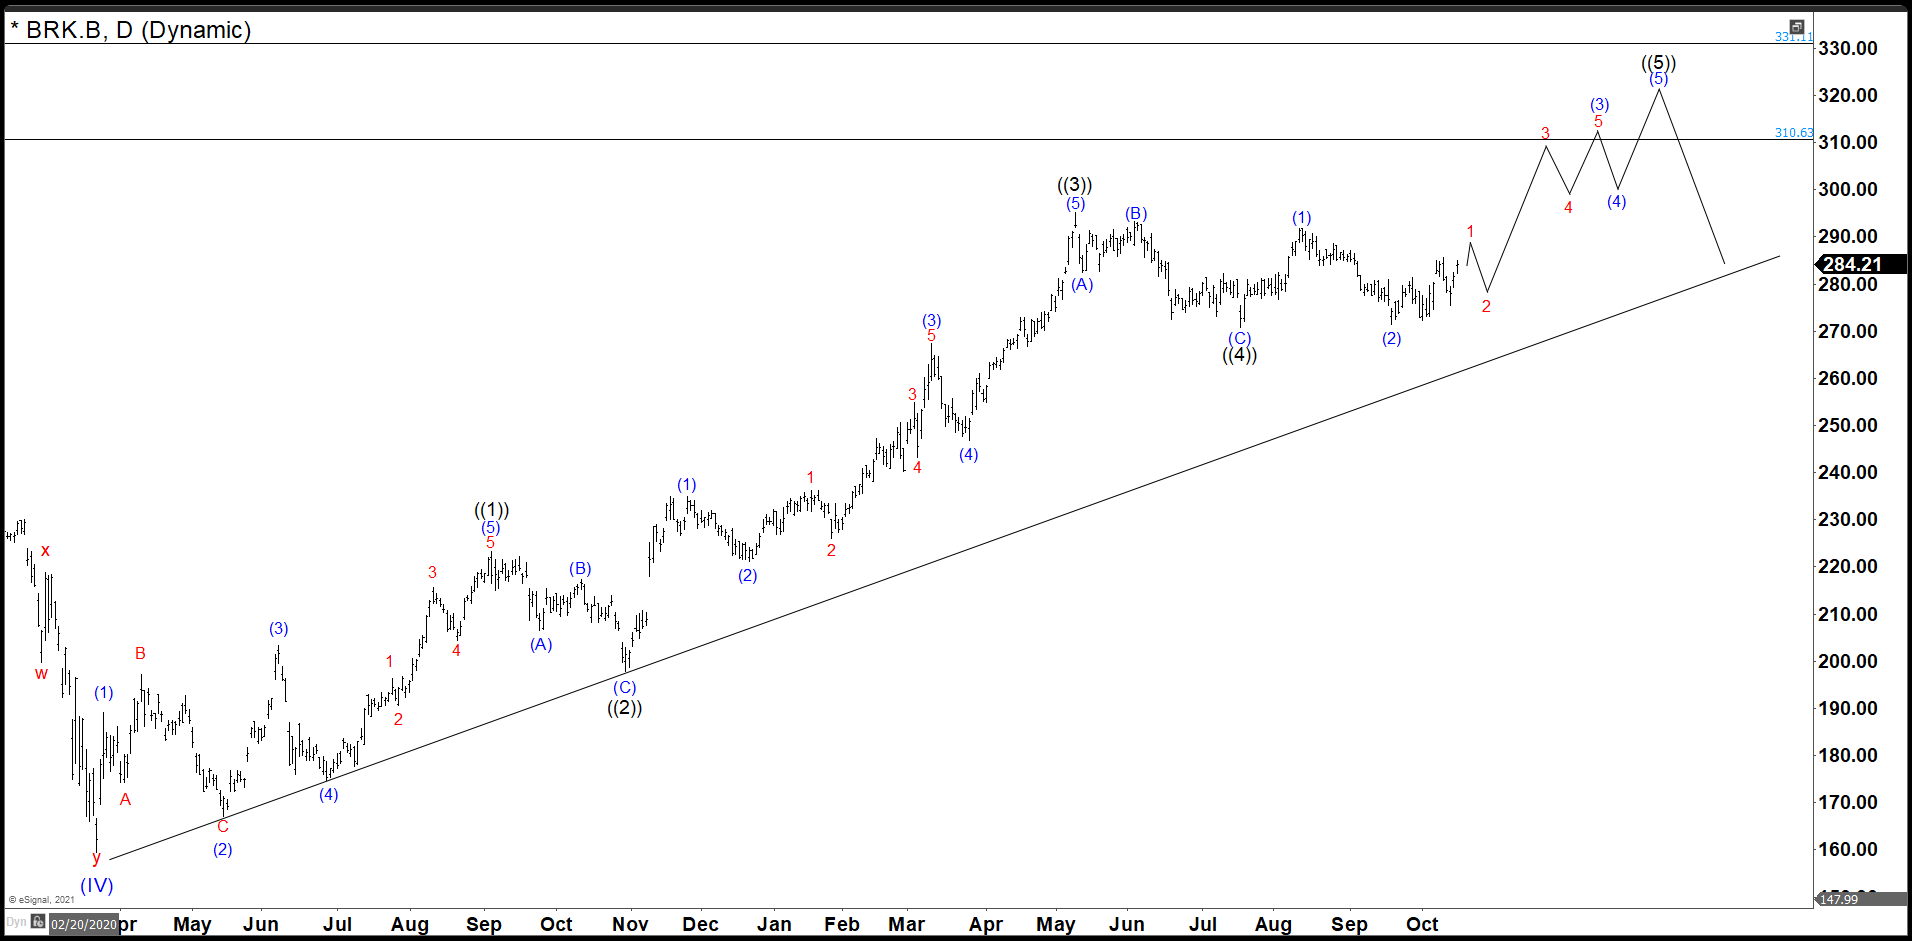
Then we restructure the impulse and wave ((3)) ended at 295.08. Wave ((4)) pullback ended at 270.73 and we should continue with the bullish momentum. We began the last impulse to complete wave ((5)). In lesser degree wave (1) ended at 291.82 and wave (2) correction ended at 271.36 and we are building wave (3). Near term, we are looking one more high to complete 5 swings up as a leading diagonal wave 1 in red and then a pullback as wave 2 in red before continue with the rally. With the actual structure, we find out the target to complete wave ((5)) comes in 310 – 331 area.
Source: https://elliottwave-forecast.com/stock-market/berkshire-hathaway-target-comes-310-331-area/