
In this technical blog, we will look at the past performance of 1 hour Elliott Wave Charts of XLP. We presented to members at the elliottwave-forecast. In which, the rally from 21 June 2021 low unfolded as an impulse structure. And showed a higher high sequence favored more upside extension to take place. Therefore, we advised members not to sell the ETF & buy the dips in 3, 7, or 11 swings at the blue box areas. We will explain the structure & forecast below:
XLP 1 Hour Elliott Wave Chart
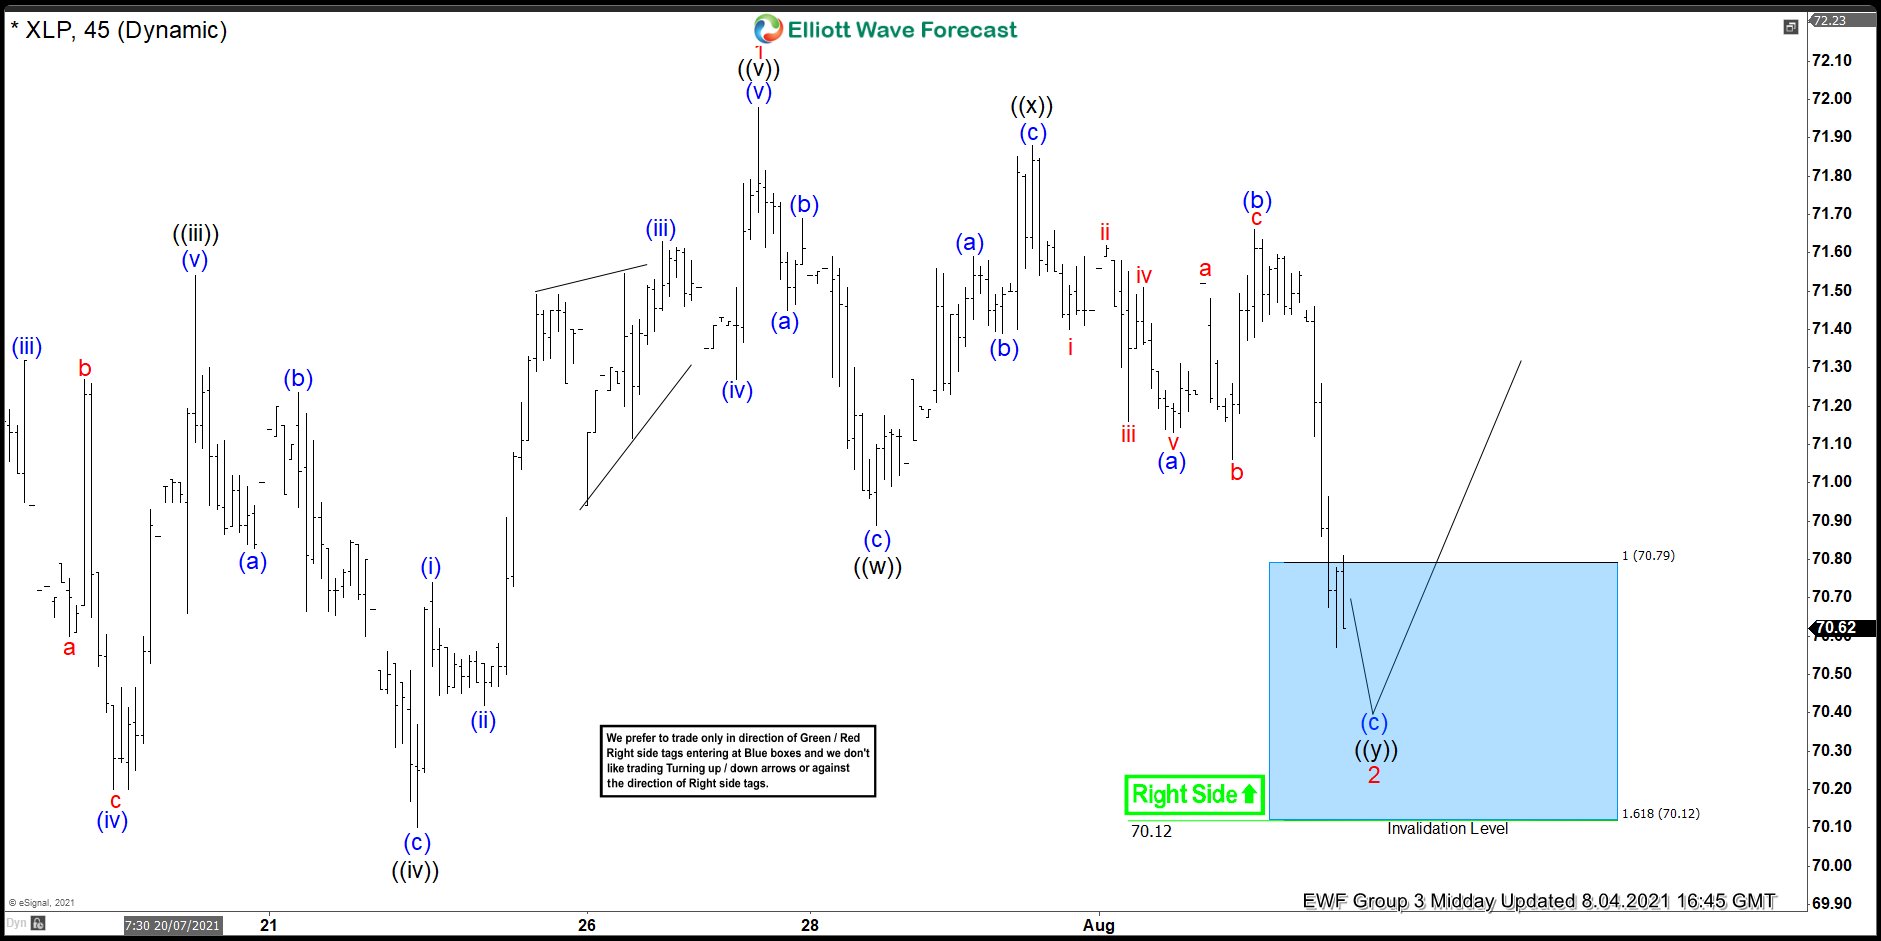
Here’s 1hr Elliott wave chart from the 8/04/2021 Midday update. In which, the cycle from 6/21/2021 low ended in wave 1 as an impulse structure at $71.98 high. Down from there, the ETF made a pullback in wave 2 to correct that cycle. The internals of that pullback unfolded as Elliott wave double three structure where wave ((w)) at $70.89 low. Wave ((x)) ended at $71.88 high and wave ((y)) managed to reach the blue box area at $70.79- $70.12 area. From there, buyers were expected to appear looking for the next leg higher or for a 3 wave bounce minimum.
XLP Latest 1 Hour Elliott Wave Chart
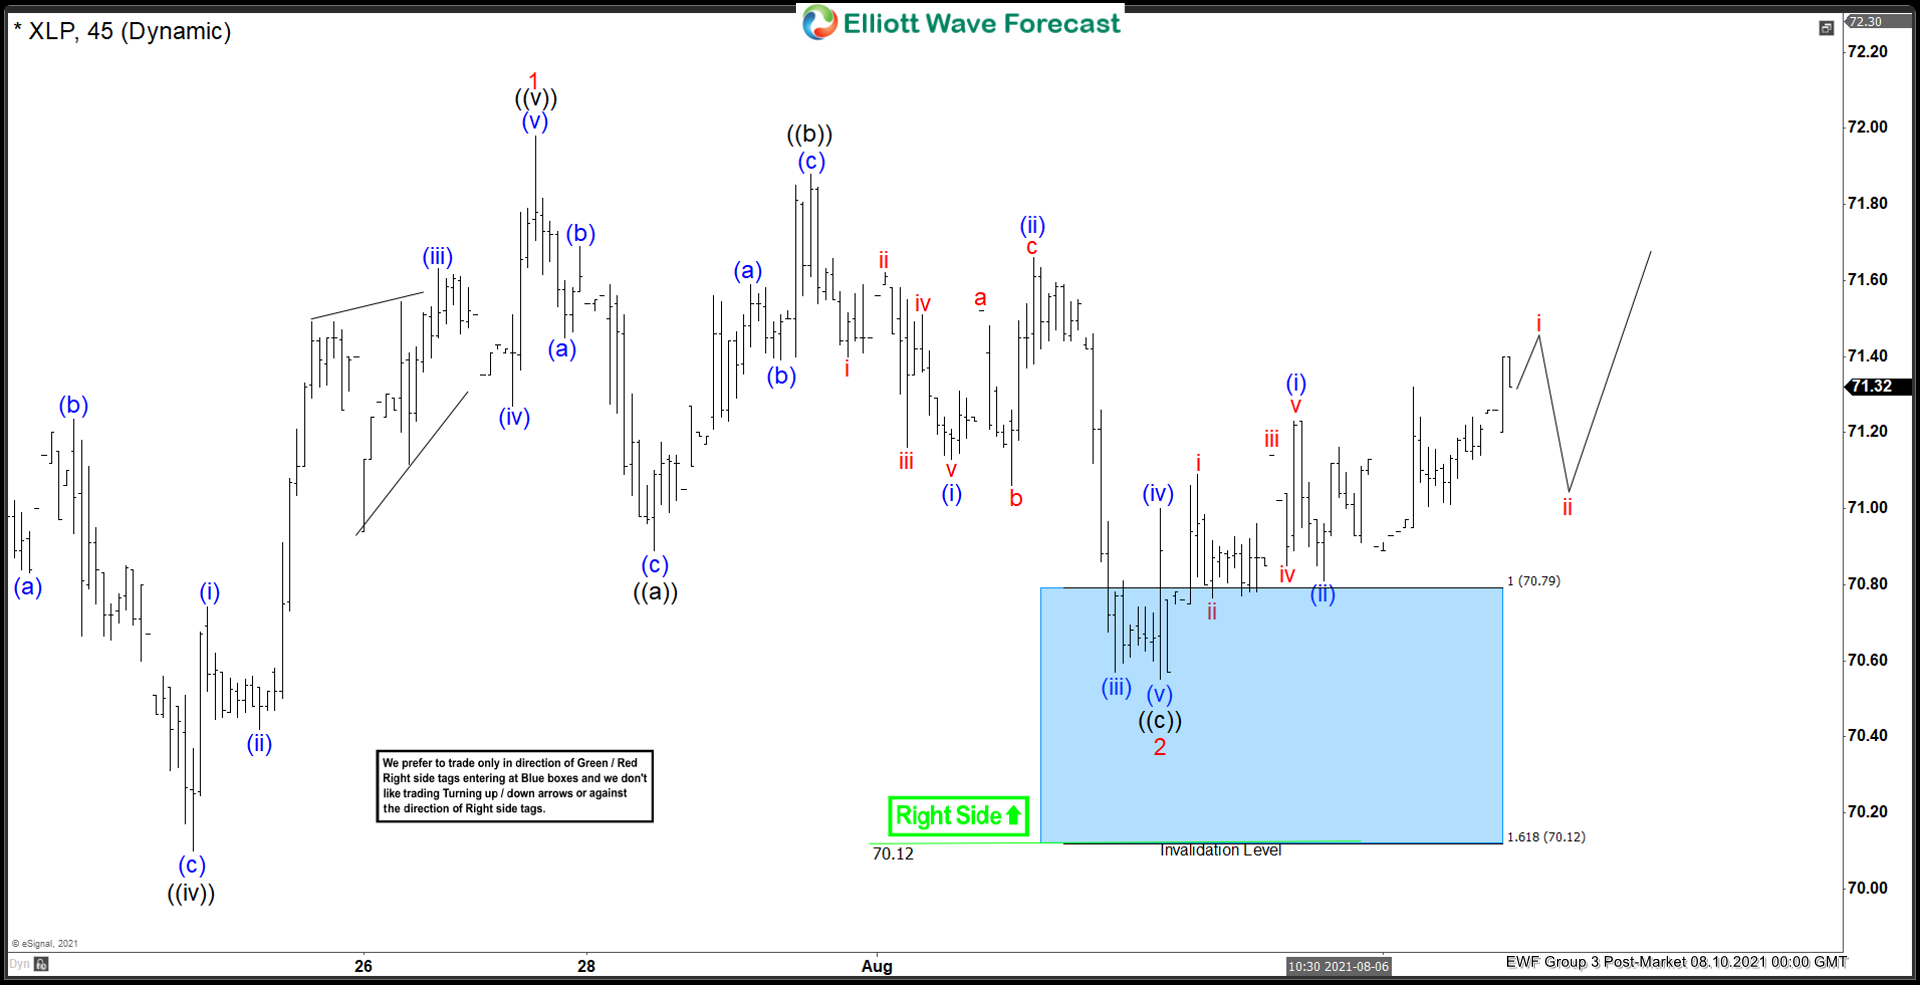
Here’s the Latest 1hr Elliott wave chart from the Post-Market update. In which the ETF is showing a reaction higher from the blue box area. Allowed members to create a risk-free position shortly after taking the long positions at the blue box area. However, a break above $71.98 high is still needed to confirm the next extension higher & avoid double correction lower. Note: later on with more data, we were able to adjust the structure of the pullback into a flat structure.
Source: https://elliottwave-forecast.com/stock-market/xlp-starting-bounce-higher-blue-box-area/