In this technical blog, we will look at the past performance of 1 hour Elliott Wave Charts of Facebook, which we presented to members at the elliottwave-forecast. In which, the rally from 07 July 2021 low unfolded as an impulse structure. And showed a bullish sequence from January lows favored more upside extension to take place. Therefore, we advised members not to sell the stock & buy the dips in 3, 7, or 11 swings at the blue box areas. We will explain the structure & forecast below:
Facebook 1 Hour Elliott Wave Chart
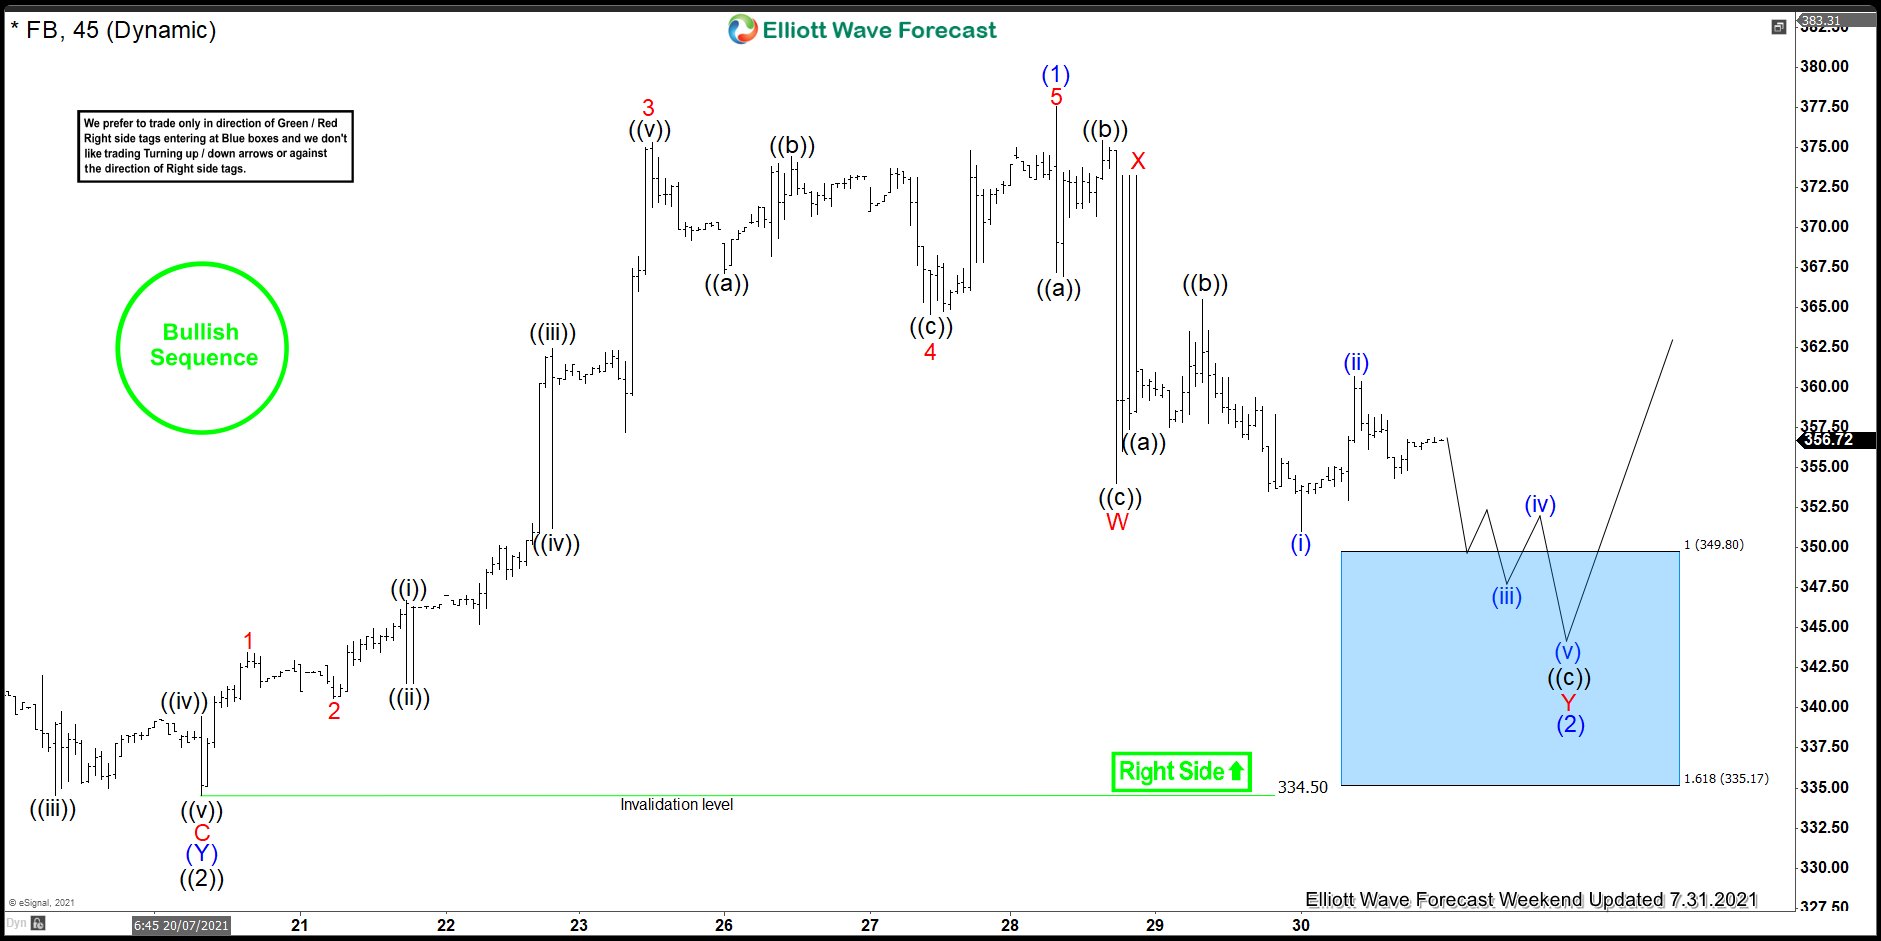
Here’s 1hr Elliott wave chart from 7/31/2021 weekend update. In which, the rally from 7/20/2021 low ($334.50) unfolded in 5 wave impulse sequence & completed wave (1) at $377.55 high. Down from there, the stock made a pullback in wave (2). The internals of that pullback unfolded as Elliott wave double three structure where wave W ended at $354 low. Wave X ended at $373.28 high and wave Y was expected to reach $349.80- $335.17 blue box area. From there, buyers were expected to appear looking for the next leg higher or for a 3 wave bounce at least.
Facebook Latest 1 Hour Elliott Wave Chart
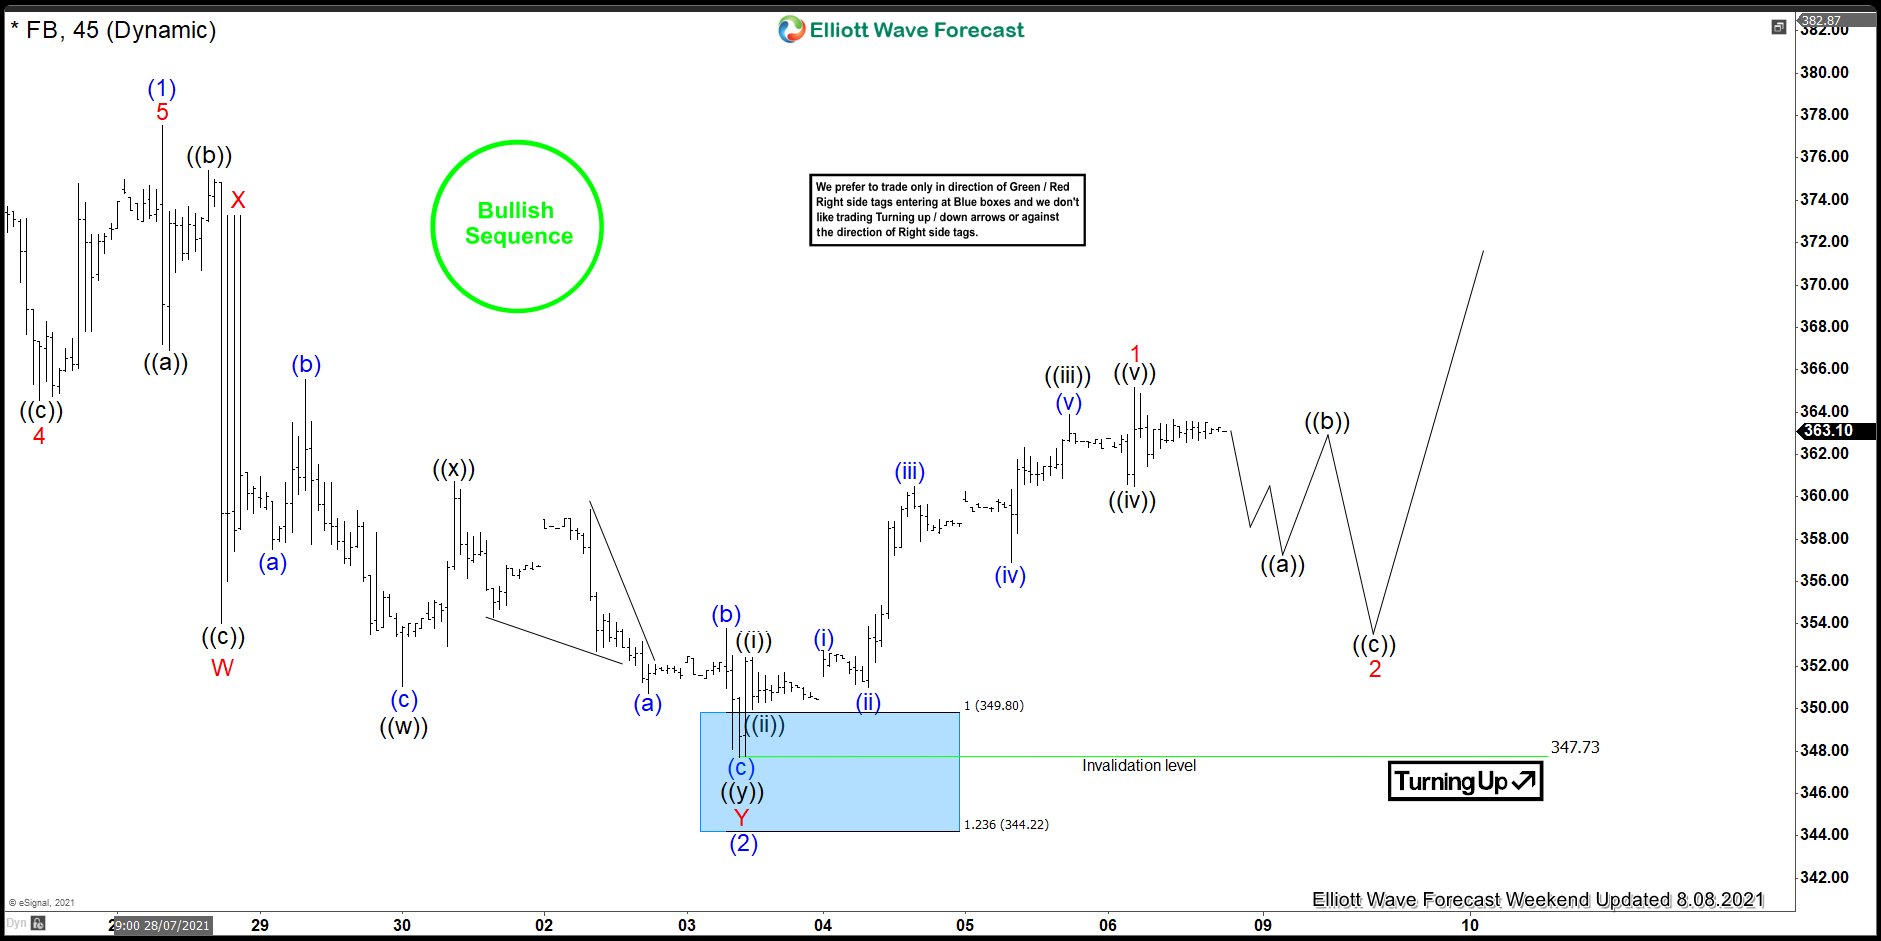
Here’s the Latest 1hr Elliott wave chart from the weekend update. In which the stock is showing a reaction higher from the blue box area. Right after ending the double three correction within the blue box area. Allowed members to create a risk-free position shortly after taking the long positions at the blue box area. However, a break above $377.55 high is still needed to confirm the next extension higher & avoid double correction lower.
Source: https://elliottwave-forecast.com/stock-market/facebook-starts-reacting-higher-blue-box/