
After 9 months, we present here an updated view on the Swiss Market Index (SMI). SMI represents a capitalization-weighted measure of the 20 most significant stocks on the SIX Swiss Exchange in Zurich; the ticker is $SMI. In the initial blog article from November 2020, we were calling the “COVID-19” drop in February-March 2020 to become a significant low in world indices. We were right. Now, SMI is trading at the all-time highs. Here we will discuss the updated monthly but also the more detailed daily views.
SMI Monthly Elliott Wave Analysis 08.01.2021
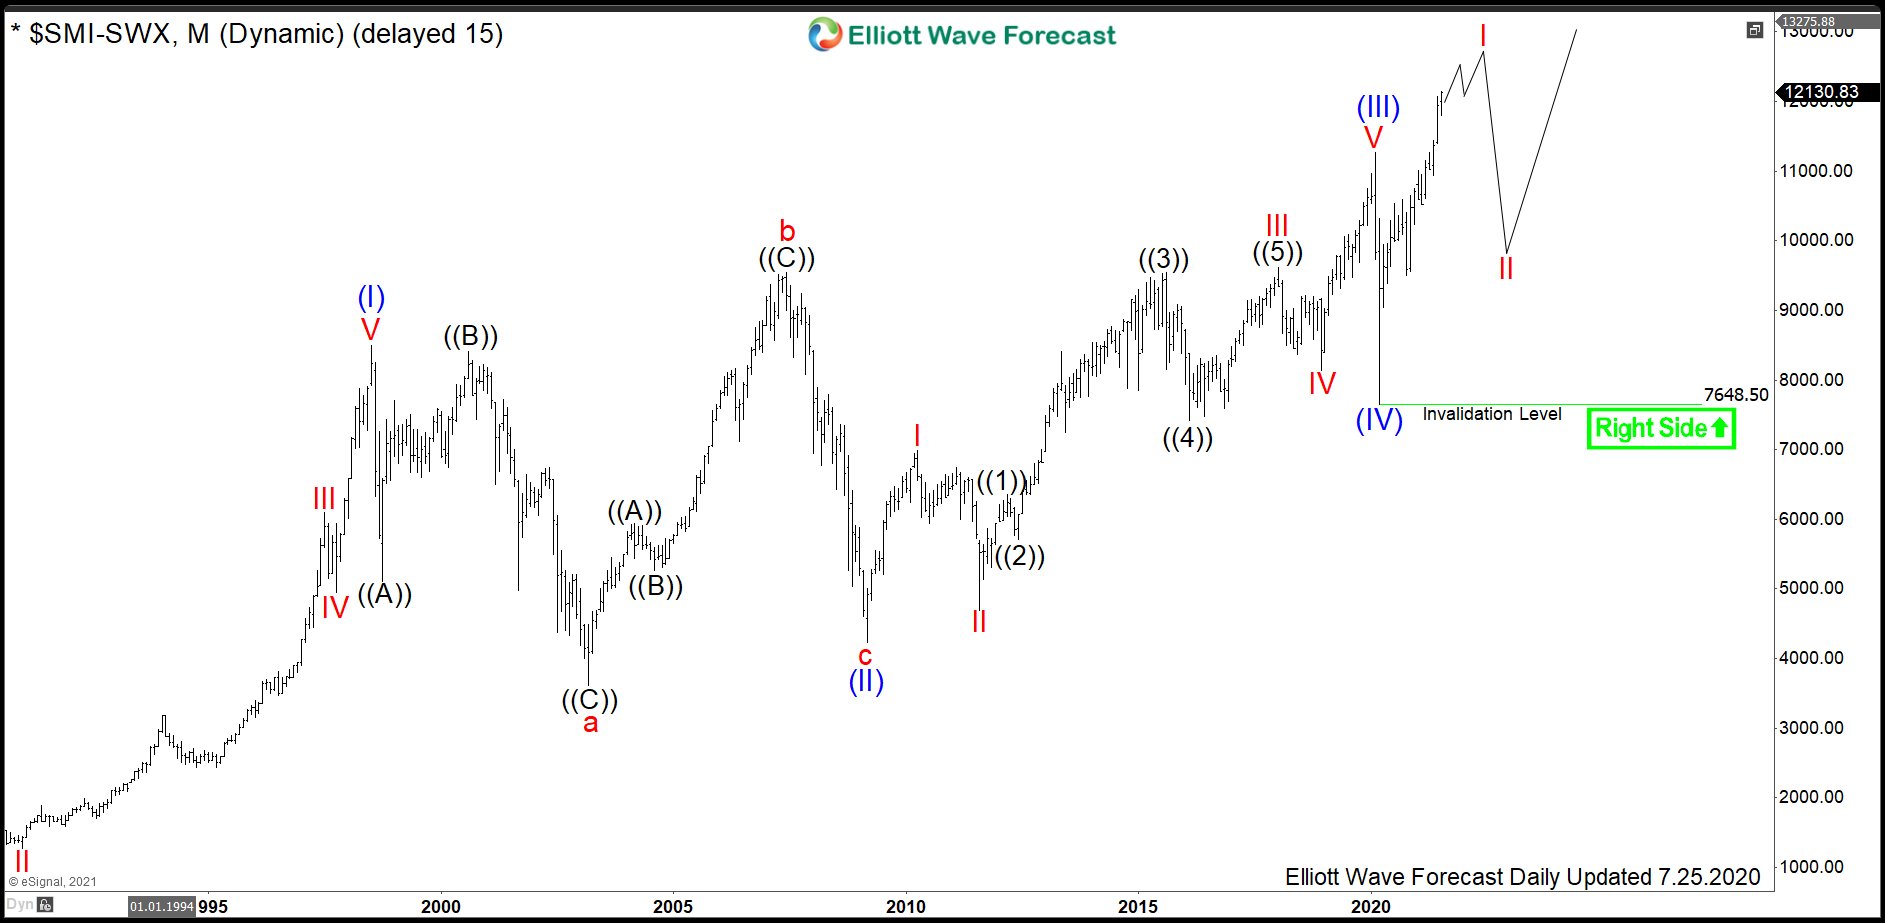
The monthly chart below shows the SMI index $SMI listed at SIX Swiss. From the all-time lows, the index price has developed a cycle higher in wave (I) of a super cycle degree. It has ended by printing a high in July 1998 at 8491. From the highs, a correction lower in wave (II) has retraced during following 10 years a half of the of the motive cycle higher towards March 2009 lows at 4216. Technically speaking, the decline can be seen as an Elliott Wave running flat pattern.
From the lows at 4216, another cycle higher in wave (III) has been confirmed by breaking 8491 highs. Later on in February 2020, it has printed a top at 11272. From the highs, a sharp decline in wave (IV) has unfolded as a straight down correction. It has found its bottom in March 2020 at 7648.5. While above there, SMI is trading already within wave (V). Indeed, this has been confirmed by breaking above 11272 to the new all-time highs.
SMI Daily Elliott Wave Analysis 08.01.2021
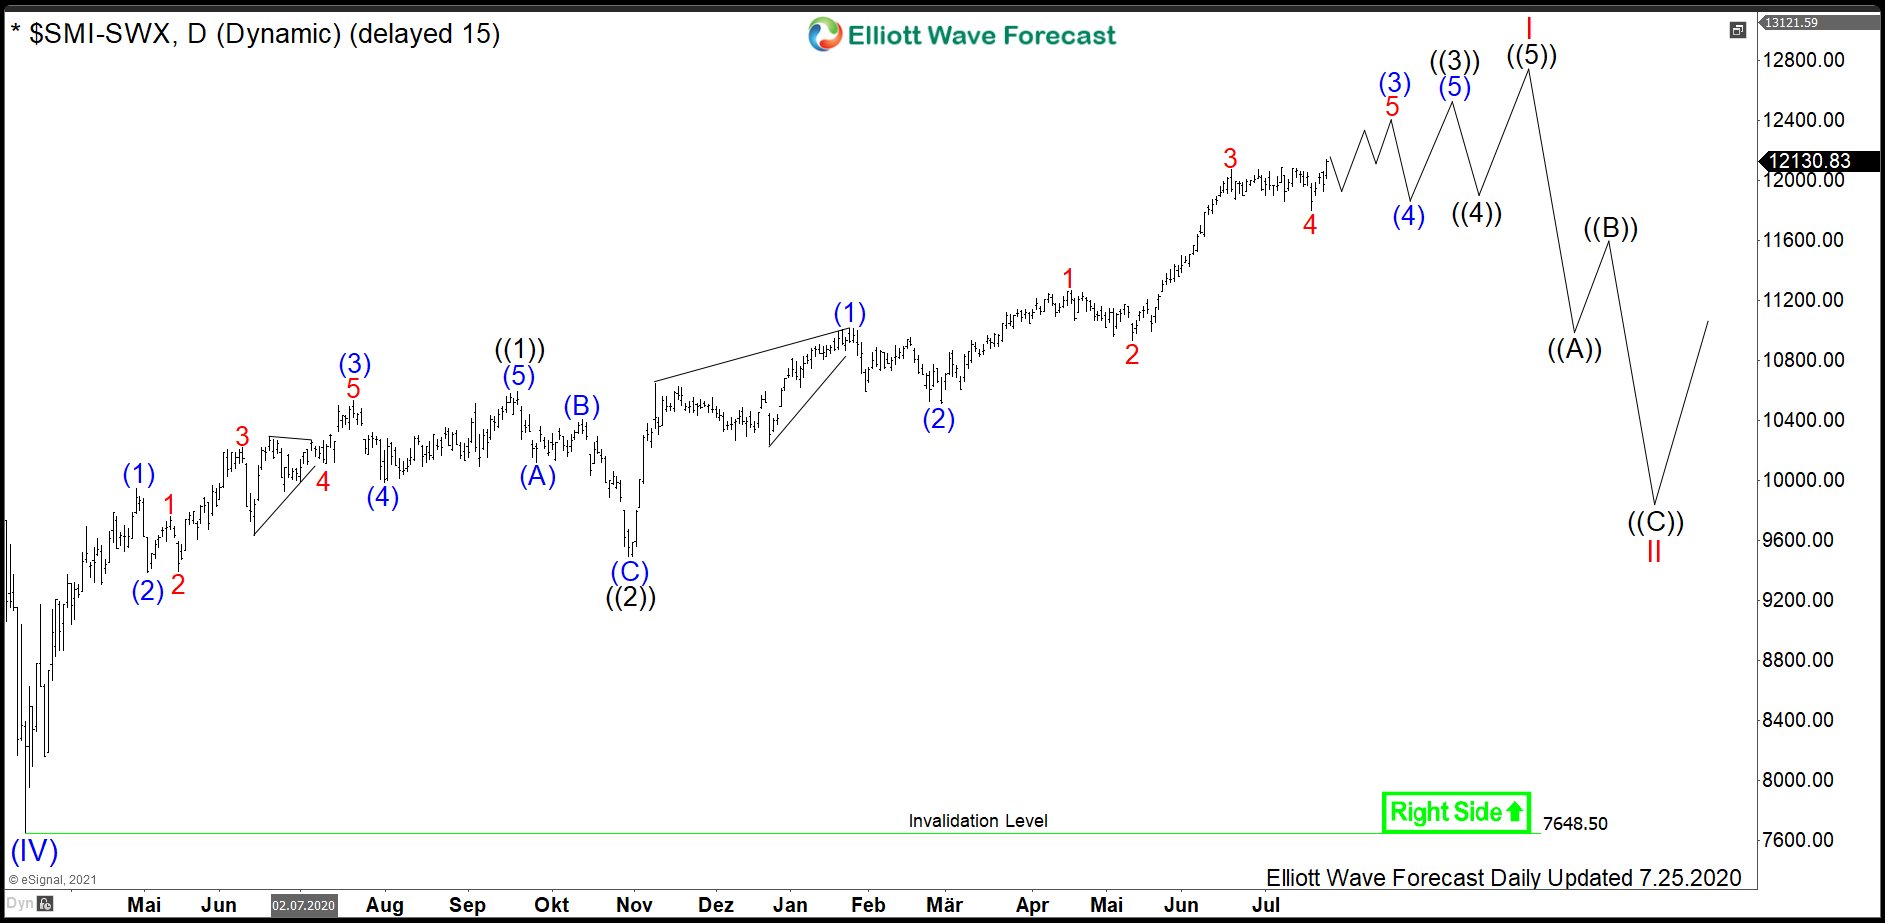
The daily chart below shows in more detail the advance higher in wave I of (V). From the March 2020 lows, wave I demonstrates three nests: ((1))-((2)), (1)-(2), 1-2. Recently, we saw an accelration higher in red 3 of blue (3) of black ((3)). Even though the main acceleration might be already over, we anticipate a series of 5th waves which should provide the new all-time highs. The short-term pullbacks should remain supported in 3, 7, 11 swings for more upside to complete the impulsive structure within wave I.
Later, we expect a pullback in wave II to take place which should correct the cycle in wave I from March 2020 lows. It should find support in 3, 7, 11 swings above 7648.5 lows for an extension higher in wave III of (V). Therefore, investors can be waiting end 2021 – start 2022 to buy SMI against 7648.5 lows for an extension higher in waves III-V of (V).
Source: https://elliottwave-forecast.com/stock-market/smi-swiss-market-index-2021/