
Since the crash of March 2020, all stocks have tried to recover what they lost and JNJ was no exception. Johnson & Johnson did not only recover the lost, but It also reached historic highs. Now, we are going to try to build a wedge from the March 2020 lows with a target above $176.
JNJ Old Daily Chart
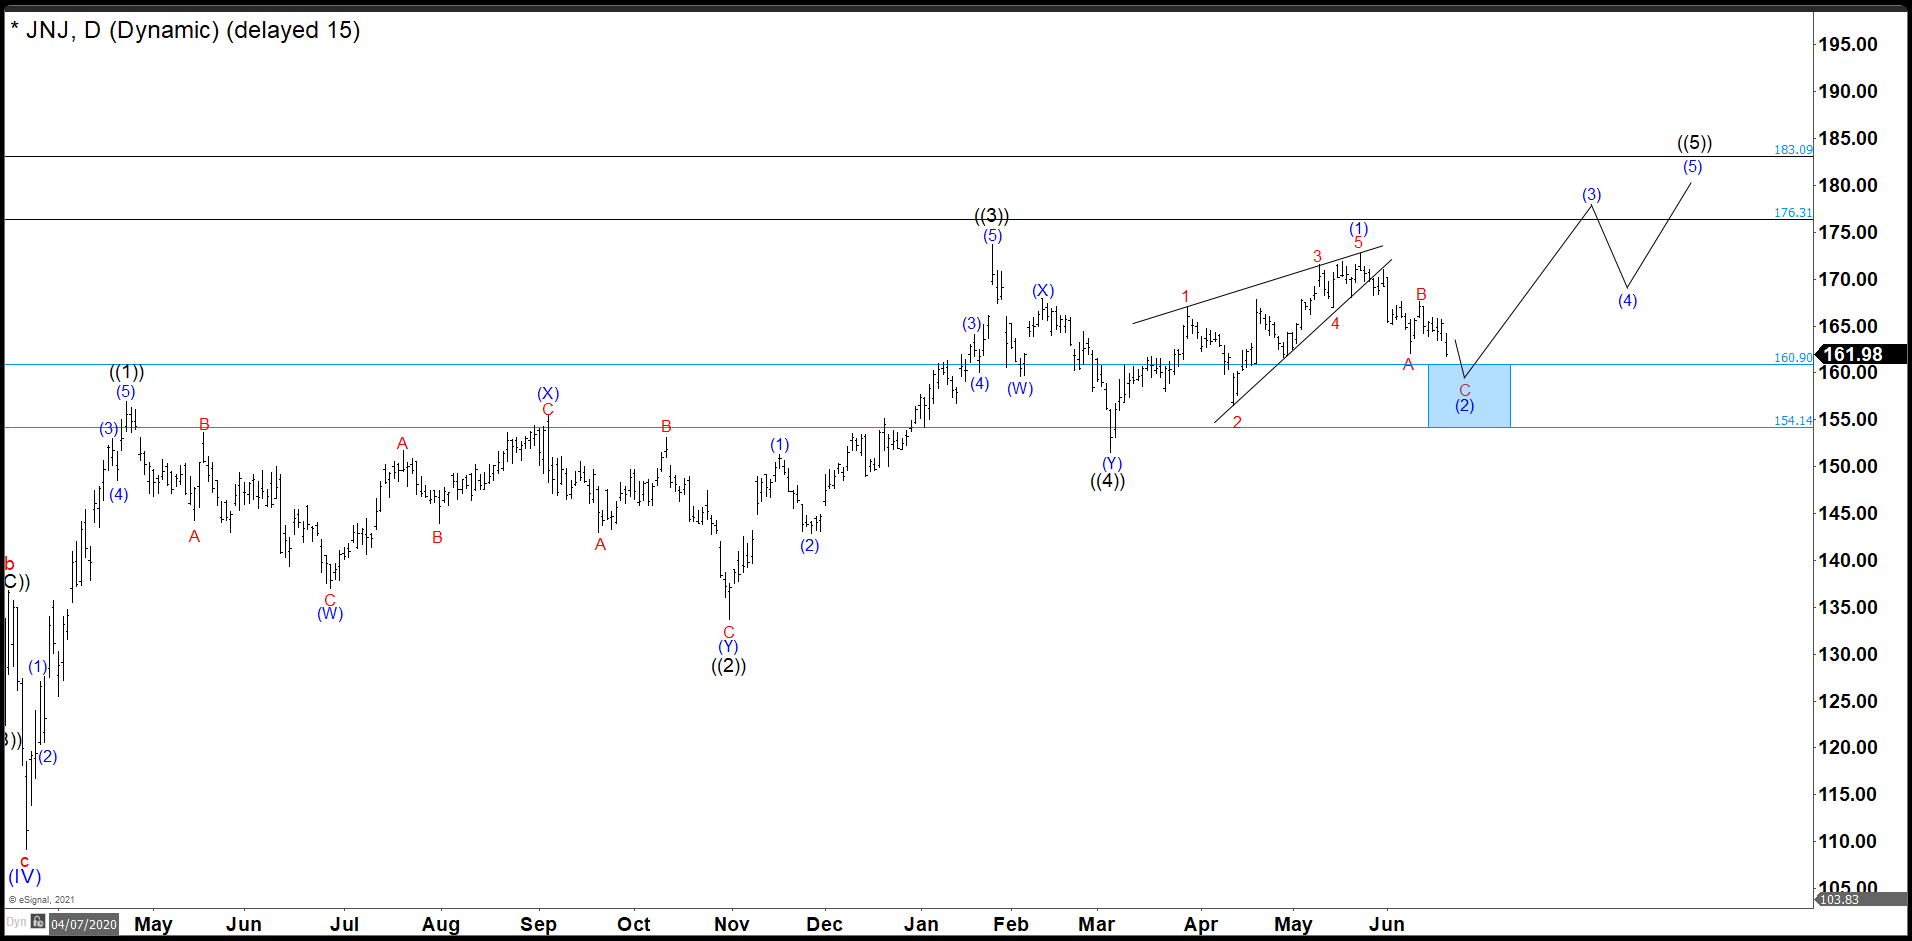
In the last chart we can clearly see that after the fall of March 2020, JNJ had a strong and rapid recovery in 3 swings. The wave ((3)) had its highest point at 173.69 where JNJ was rejected by the market. This rejection did another double correction structure and overlaps the wave ((1)) zone to end the wave ((4)) and from here it should continue higher to complete wave ((5)) as a diagonal. (If you want to learn more about Elliott Wave Theory, please follow this link: Elliott Wave Theory).
JNJ Daily Chart
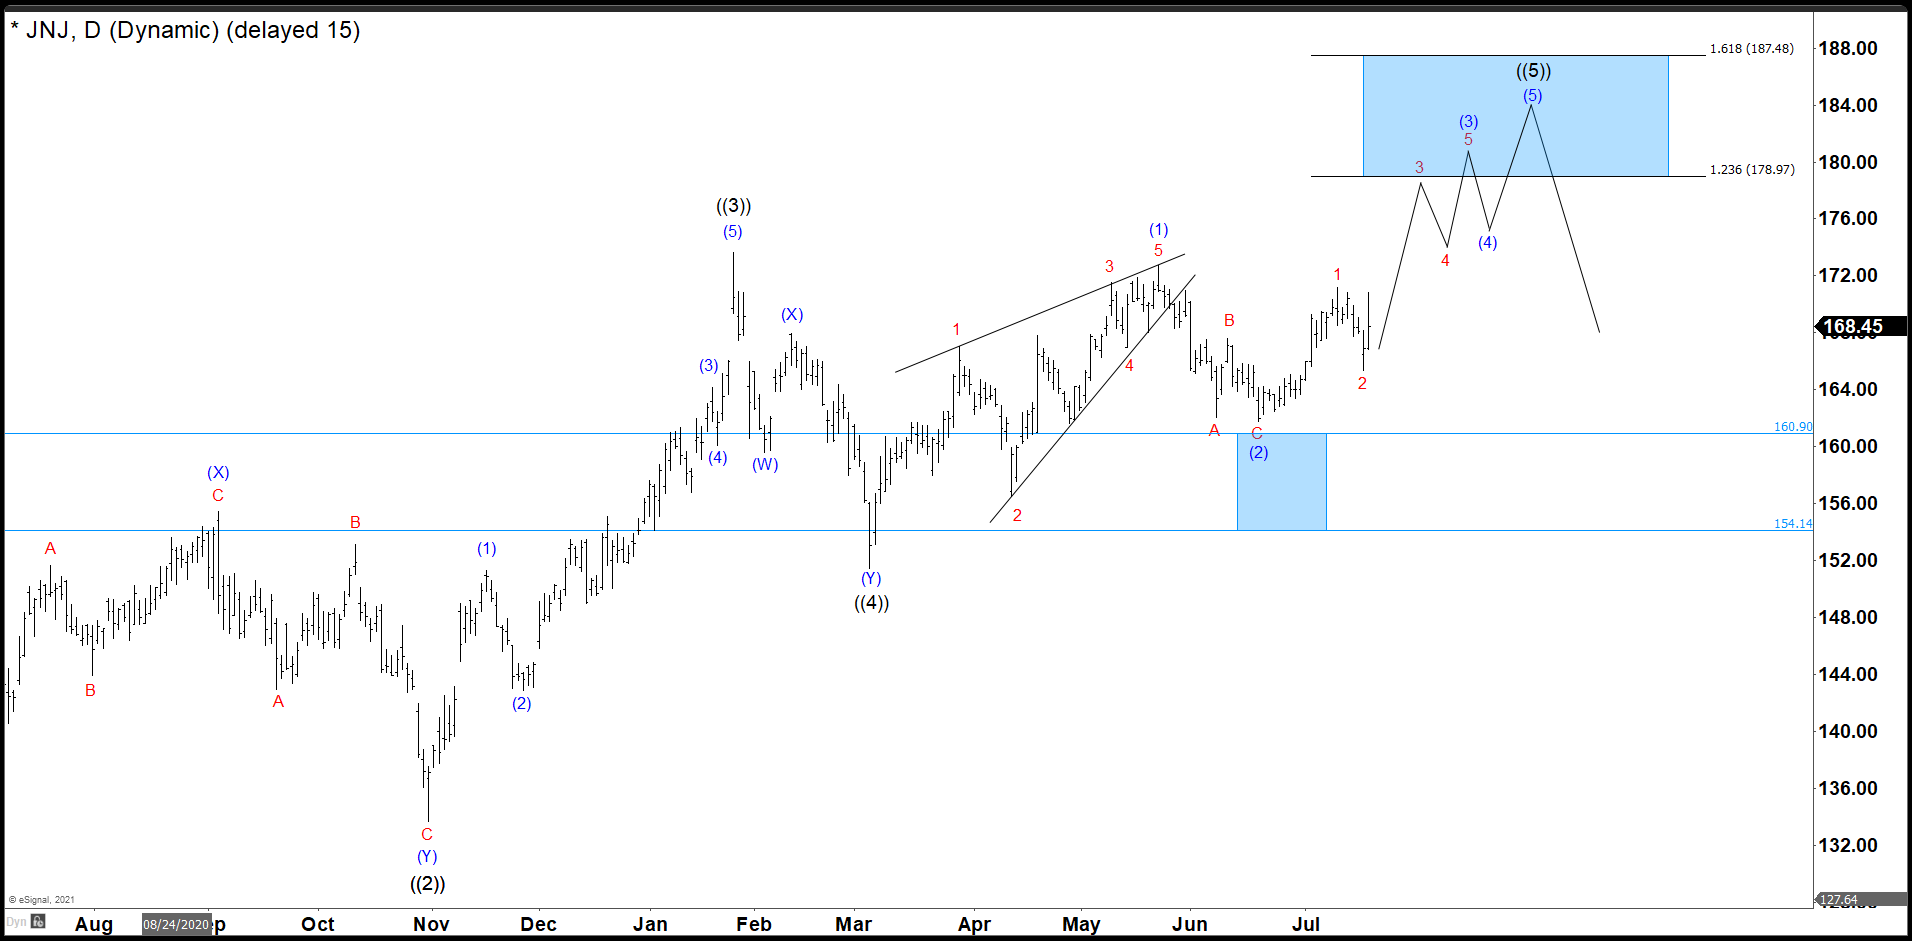
The share price continued to rise until reaching 172.79, which we call wave (1) and you can see the structure is a Leading Diagonal. From there, we have a clear correction in a zig zag as wave (2) missing our ideal entry for a few cents. Short term, we already have completed the wave 1 of (3) at 171.20 and wave 2 of (3) correction at 165.25. JNJ is moving forward with the rally and needs to break 171.20 to confirm the Elliott structure. We cannot rule out yet the possibility of a flat correction as wave 2. That means it could reach 164.94 before continue higher. That count is valid as we stay above 161.70 and the possible target to complete wave ((5)) comes in 178.97 – 187.48 area.
Source: https://elliottwave-forecast.com/stock-market/jnj-continue-rally-missed-entry/