Hello fellow traders. In this technical blog we’re going to take a quick look at the Elliott Wave charts of Sugar futures , published in members area of the website. As our members know Sugar is showing impulsive bullish sequences in the cycle from the April 2020 low . We expected the commodity to keep finding buyers for further extension higher. We recommended members to avoid selling in any proposed pull back and keep buying the dips in 3,7,11 swings. Recently Sugar made a 3 waves pull back that have given us a good buying opportunity . In the further text we are going to explain the Elliott Wave Pattern Forecast and Trading Strategy.
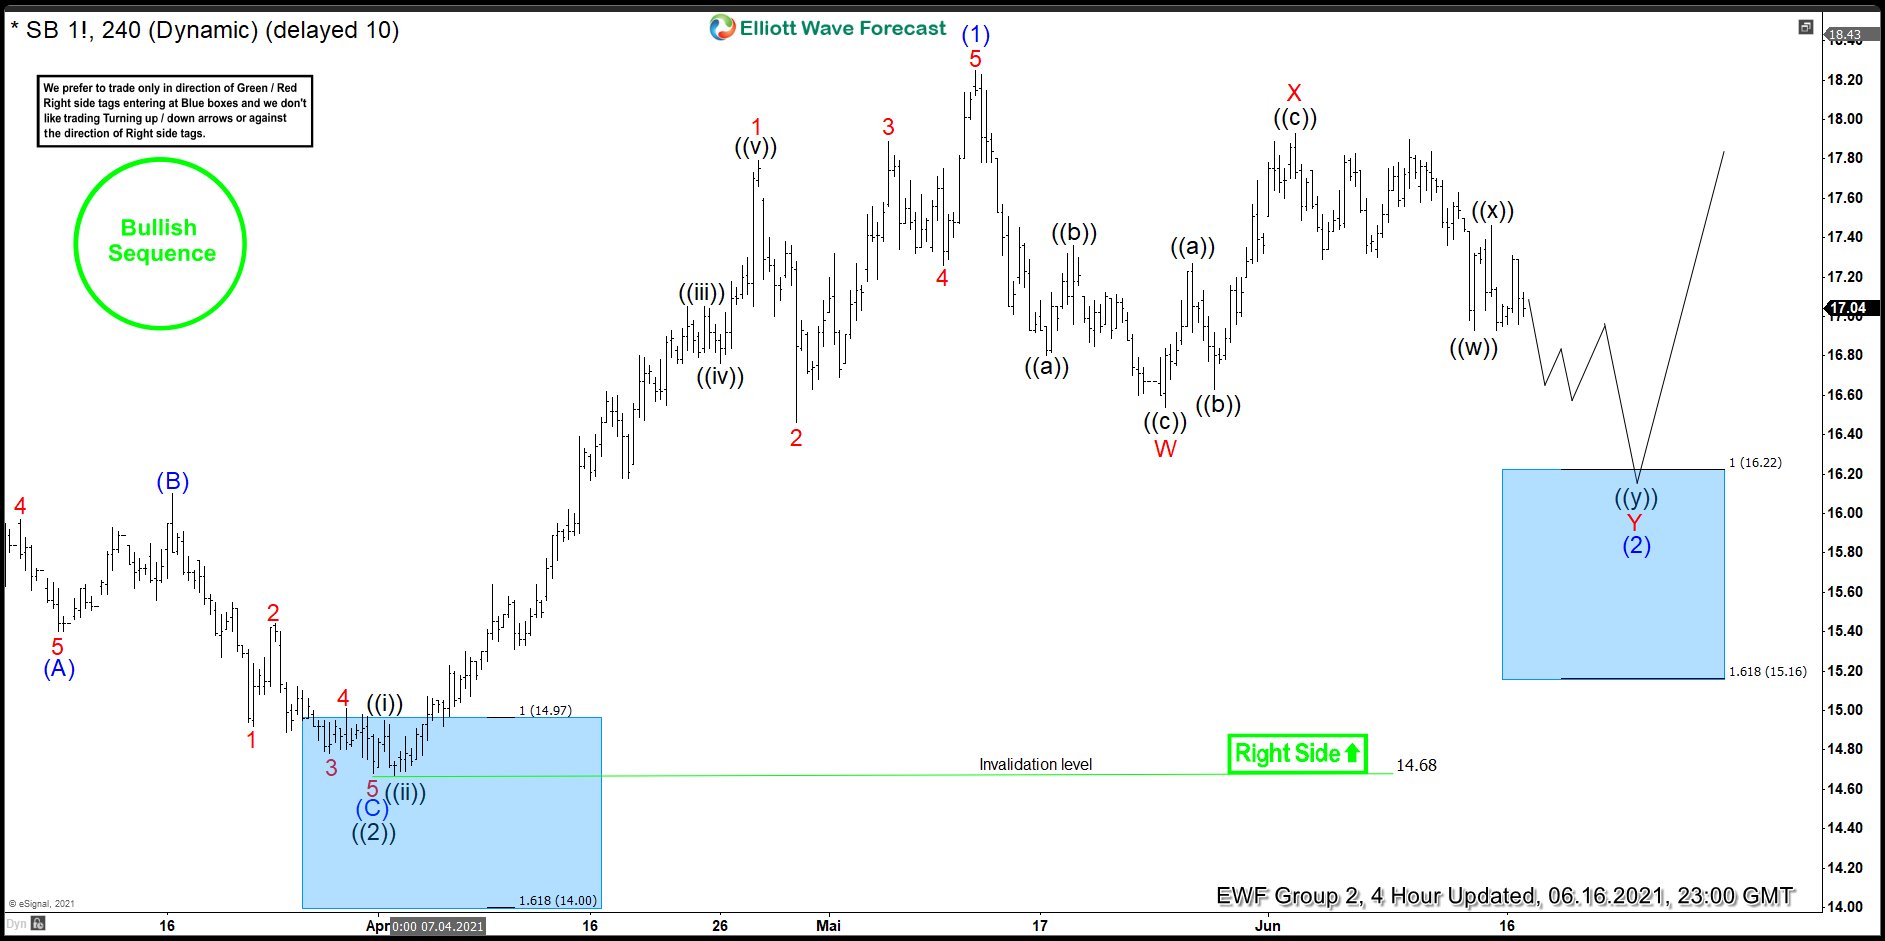
Sugar SB 1! Elliott Wave 4 Hour Chart 06.16.2021
Current view suggests the commodity is doing wave (2) correction. Pull back looks incomplete at the moment looking for another leg down toward 16.22-15.16 area. Don’t recommend selling the commodity in any proposed leg down. Strategy is waiting for the extreme zone to be reached at 16.22-15.16 before entering the long side. As the main trend is bullish , we expect buyers to appear at the blue box for a 3 waves bounce at least. As soon as the bounce reaches 50 Fibs against the X red connector high we will make long positions risk free ( put SL at BE). Invalidation for the trade would be break below 1.618 fib ext:15.16.
Reminder: You can learn about Elliott Wave Patterns at our Free Elliott Wave Educational Web Page.
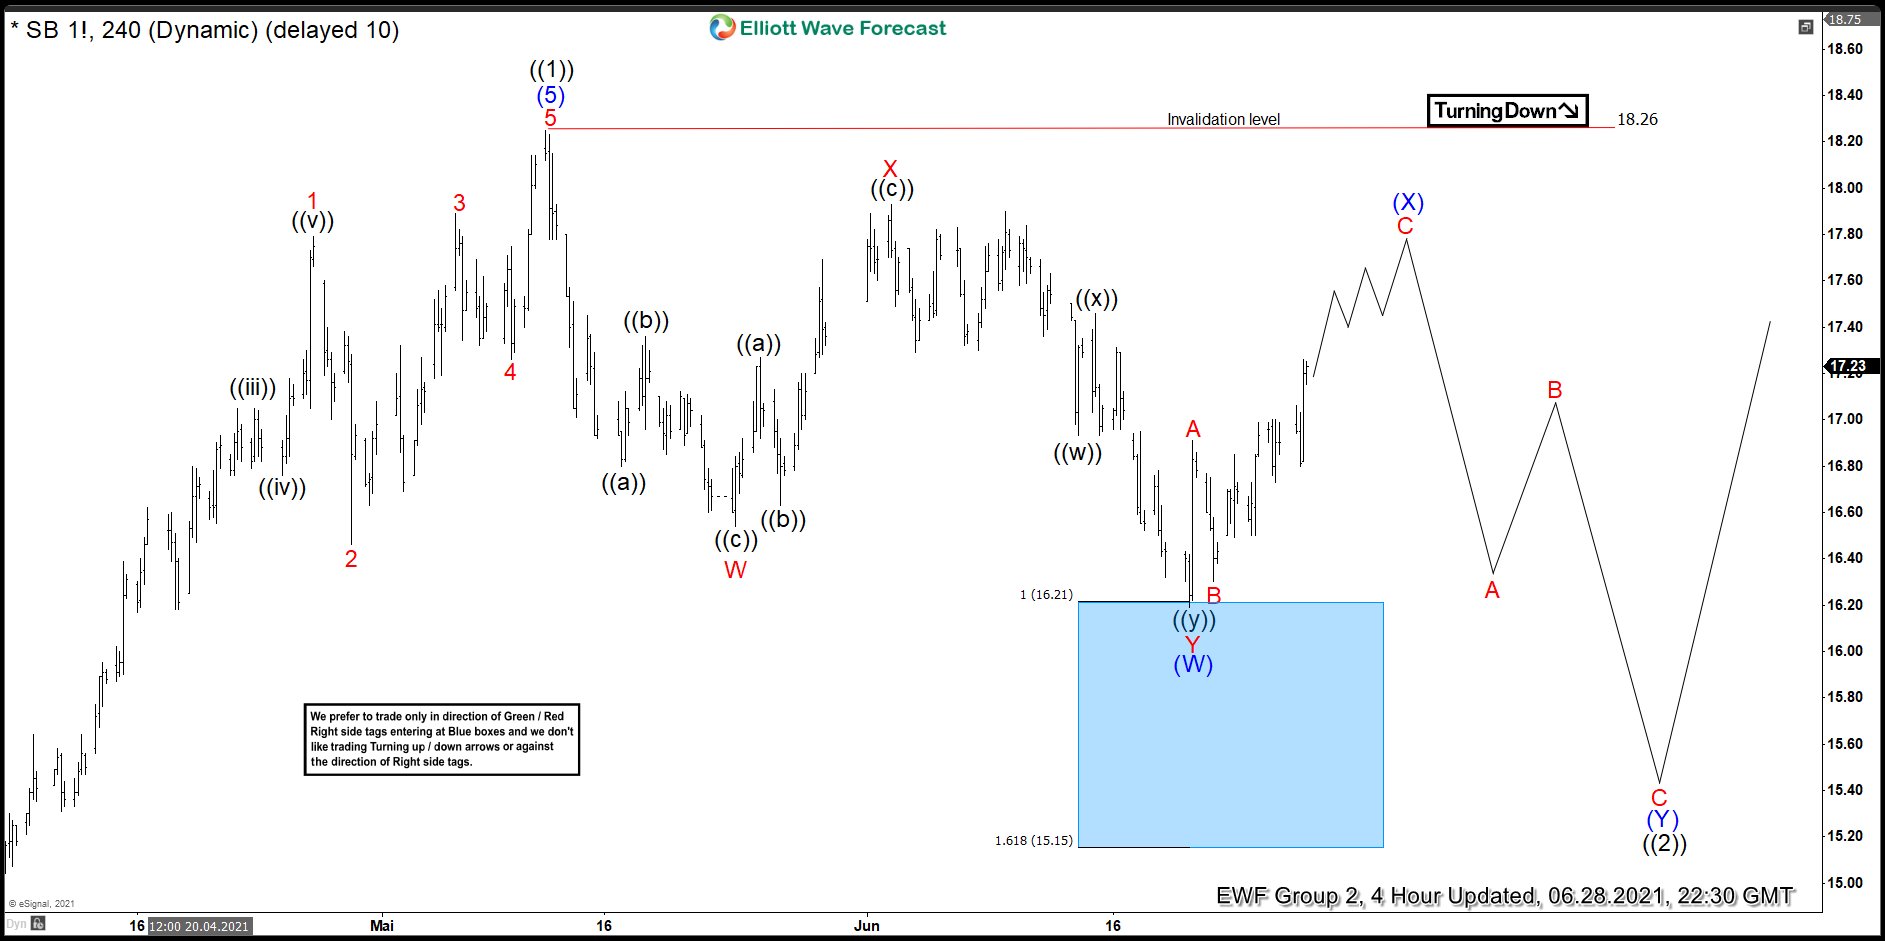
Sugar SB 1! Elliott Wave 4 Hour Chart 06.28.2021
Eventually Sugar made proposed leg down toward the blue box (16.22-15.16 ) as we expected. Buyers appeared right at the equal legs 16.22 and we got nice reaction. At this moment rally has already reached 50 Fibs against the X red connector, so members who took long trades are enjoying profits within risk free positions. At this stage we see chance that commodity still might see another leg down due to Dollar strength. Anyway we don’t recommend selling the commodity against the main bullish trend and favor staying in long positions from the Blue Box area. We are aware that Wave ((2)) pull back does not have to made proposed leg down. We already got clear 3 waves down and pull back ((2)) can be already completed.
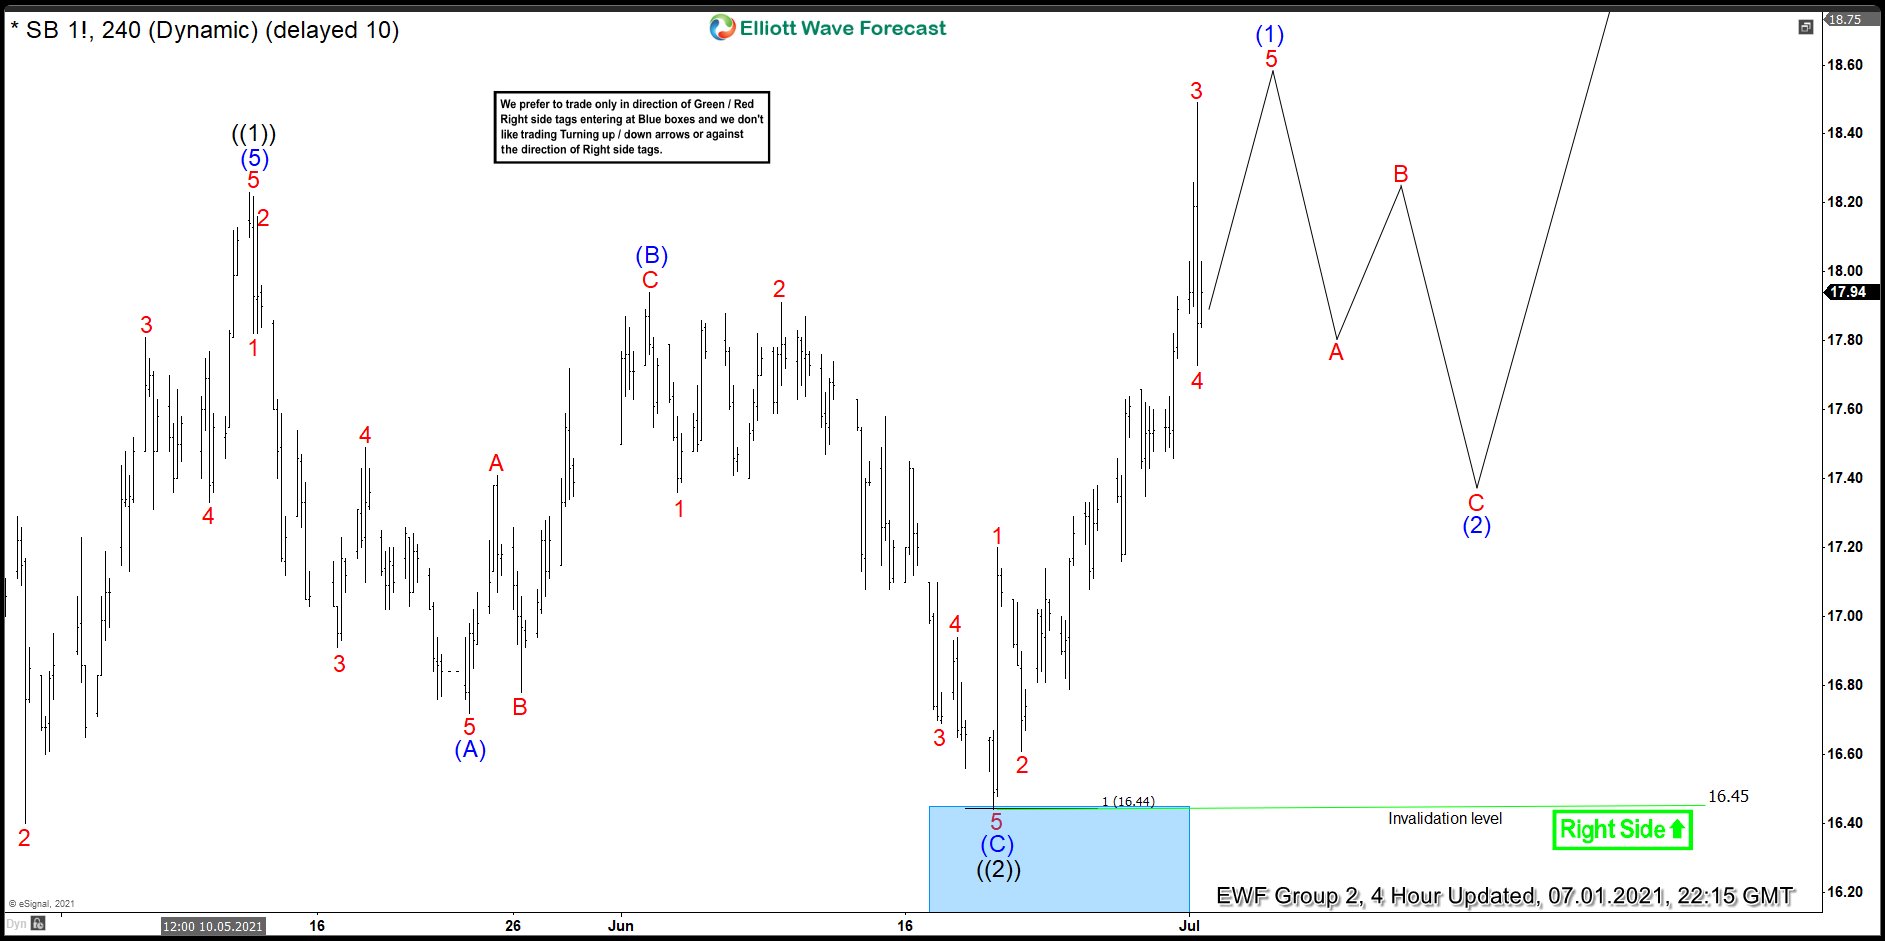
Sugar SB 1! Elliott Wave 4 Hour Chart 07.01.2021
In the meantime Sugar keeps getting strong. It made break above previous 18.26 peak confirming next leg up is already in progress. The commodity remains bullish against the 16.45 low in first degree. We expect it to keep finding buyers in 3,7,11 swings.
Keep in mind that market is dynamic and presented view could have changed in the mean time. Best instruments to trade are those having incomplete bullish or bearish swings sequences. We put them in Sequence Report and best among them are shown in the Live Trading Room. You can check most recent charts in the membership area of the site.
Elliott Wave Forecast
Source: https://elliottwave-forecast.com/elliottwave/sugar-sb_f-buying-dips-elliott-wave/