
Hello fellow traders. In this technical blog we’re going to take a quick look at the Elliott Wave charts of IBEX index published in members area of the Elliottwave-Forecast . As our members know, IBEX is another index that has given us good trading opportunity recently. The index is showing impulsive sequences in the cycle from the March 2020 low. Also showing incomplete higher high sequences in the cycle from the 10/25 low, suggesting further extension higher. We recommended members to avoid selling and keep on buying the dips in 3,7,11 swings. Recently we got short term pull back that has given us opportunity to enter long trades again. In further text we’re going to explain the forecast and trading strategy.
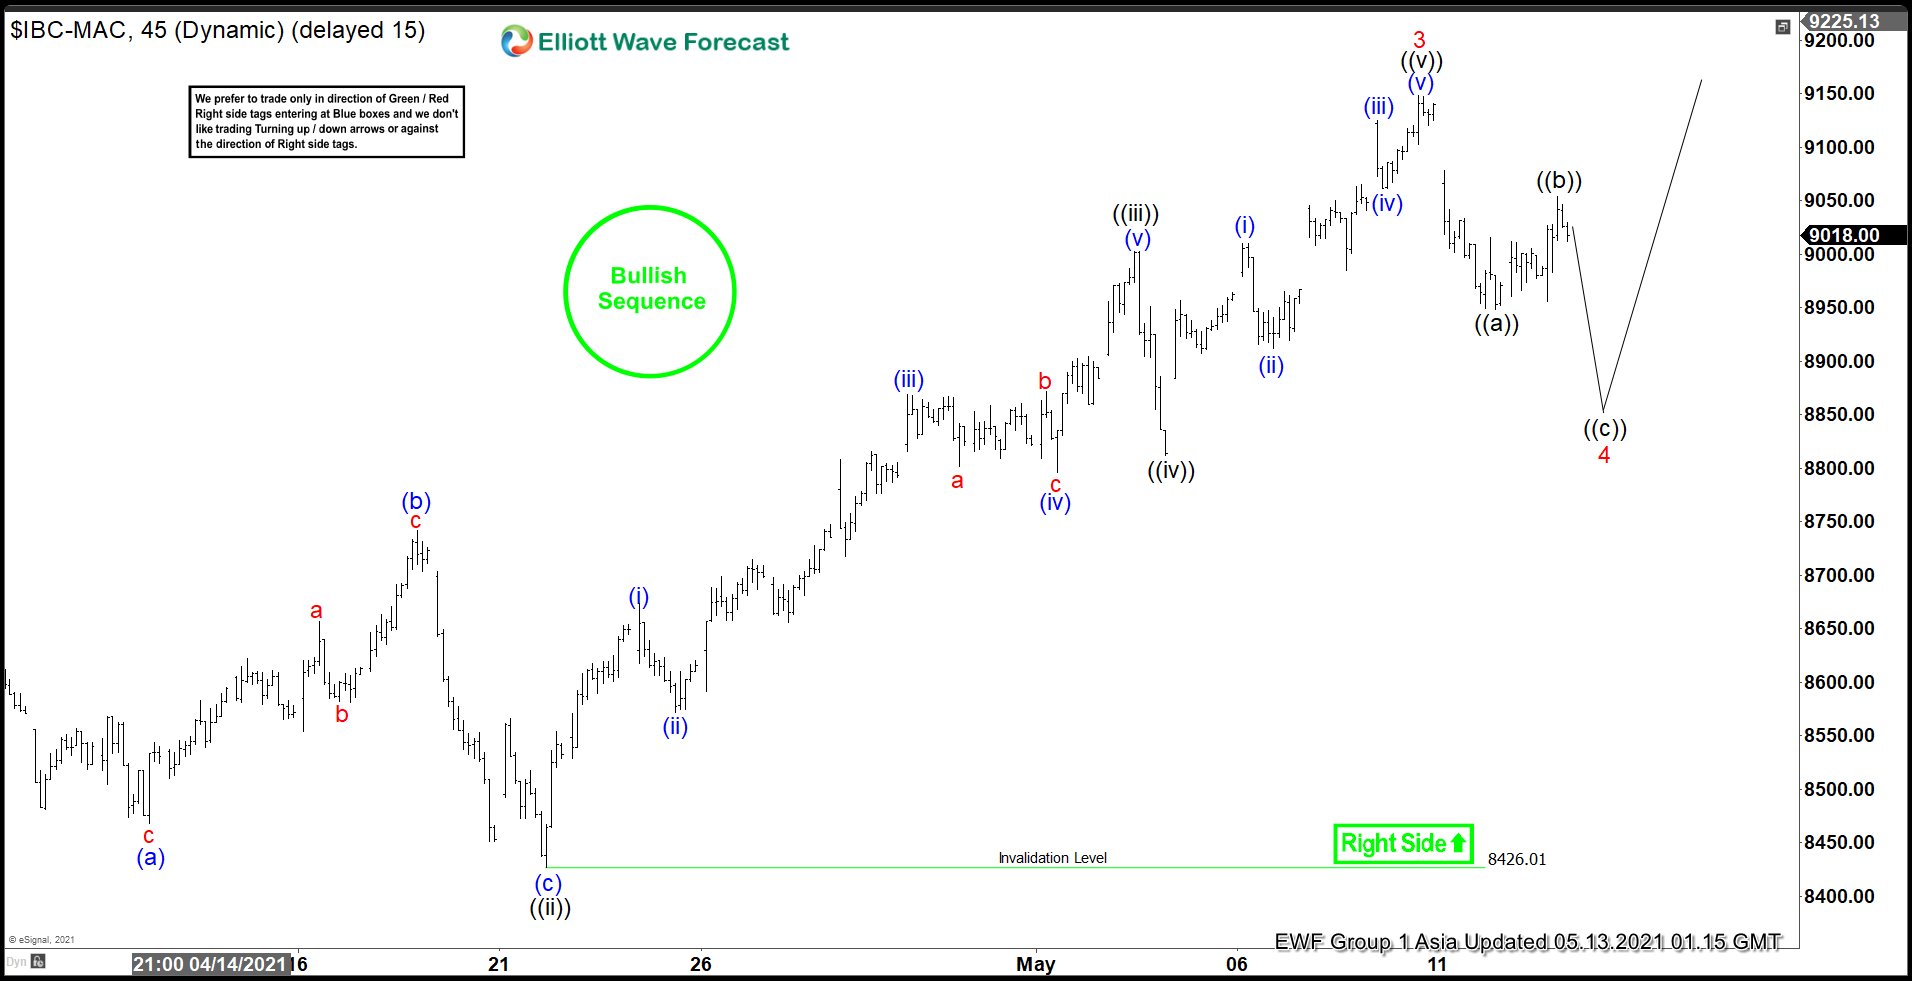
IBEX 1 Hour Asia Elliott Wave Analysis 5.13.2021
IBEX is correcting the rally from the 3/23 low. We assume 4 red pull back is still in progress as Elliott Wave ZigZag pattern. The index made 5 waves down from the peak in ((a)) black and 3 waves bounce in ((b)) black. Ibex should ideally give us another leg down ((c)) of 4 before buyers appear again for further rally or 3 waves bounce alternatively. We don’t recommend selling it against the main bullish trend.
You can learn more about Elliott Wave Patterns at our Free Elliott Wave Educational Web Page.
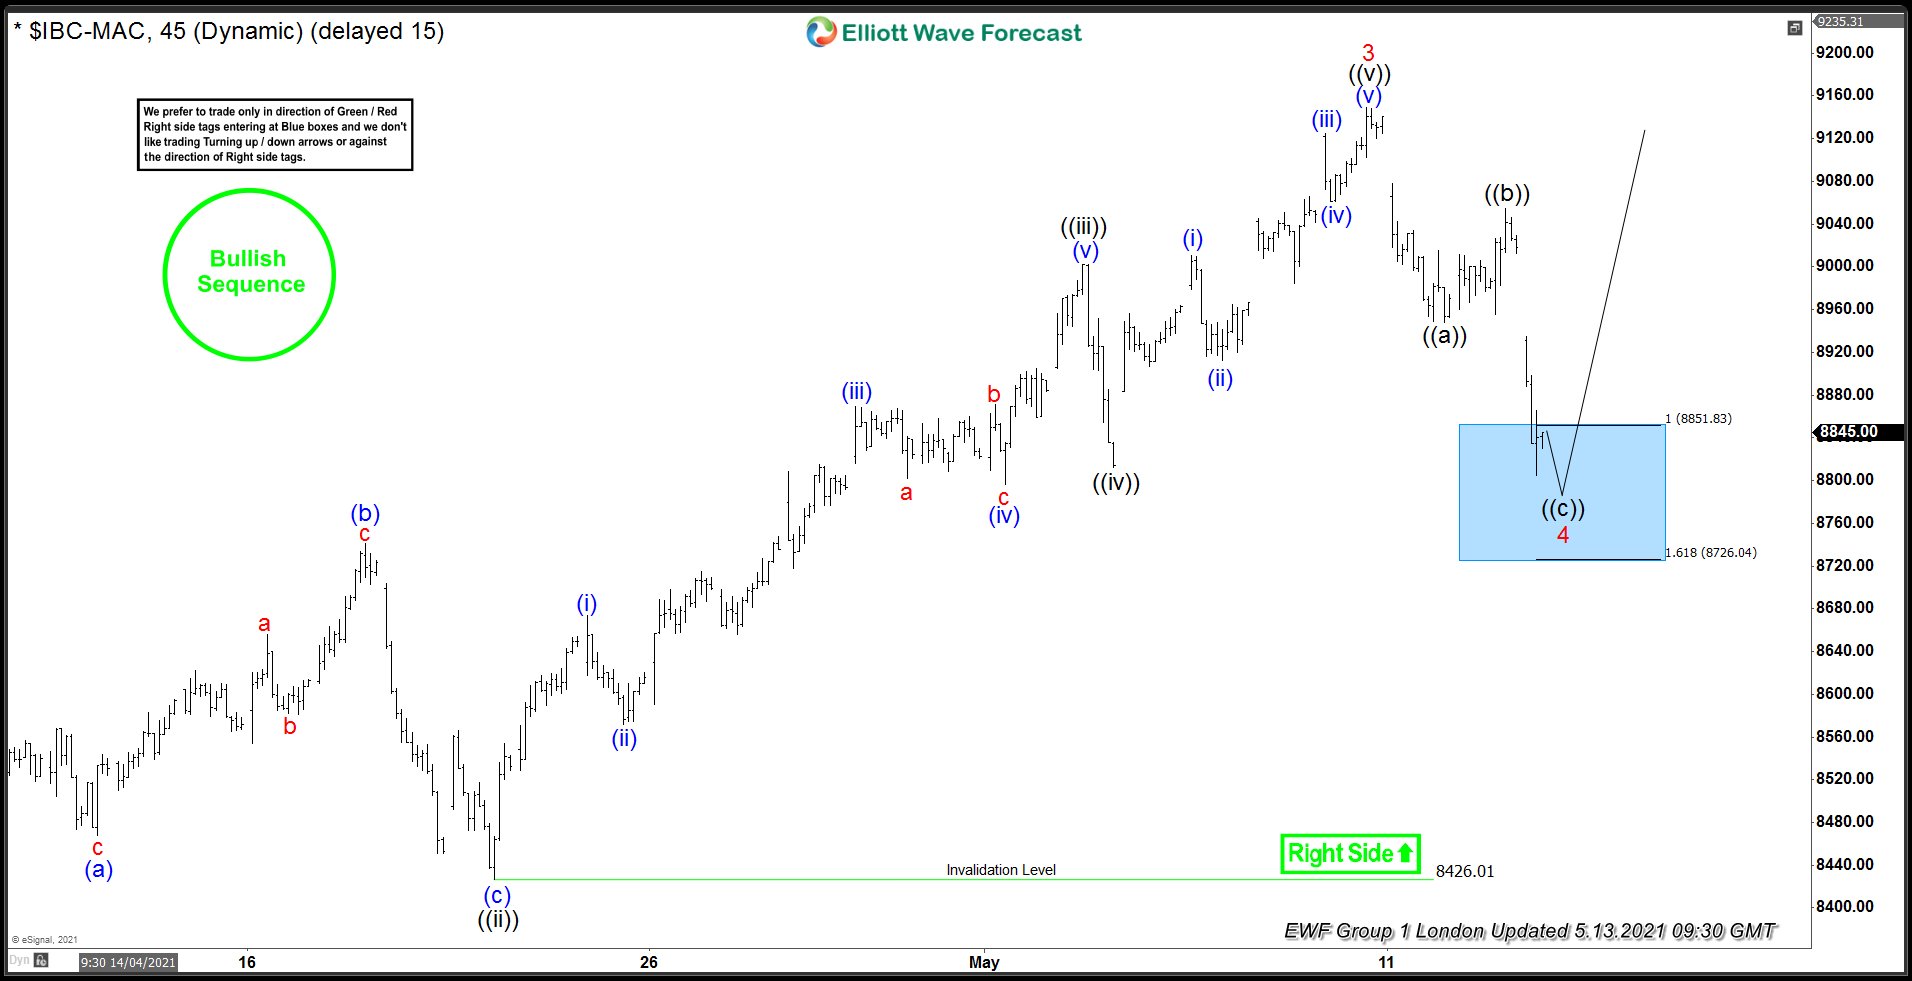
IBEX 1 Hour London Elliott Wave Analysis 5.13.2021
IBEX made proposed leg down and reached equal legs ((a))-(b)) at 8851.83-8726.04 . At that zone we would like to be buyers , looking for further rally toward new highs ideally. As the main trend is bullish, we should get 3 wave bounce at least from the Blue Box buyers zone. Invalidation level for the trade would be break below 1.6148 fib extension (8726.04). As our members know, Blue Boxes are no enemy areas , giving us 85% chance to get a bounce. As soon as the price reaches 50 Fibs against the ((b)) peak, we will make long positions risk free ( put SL at BE).
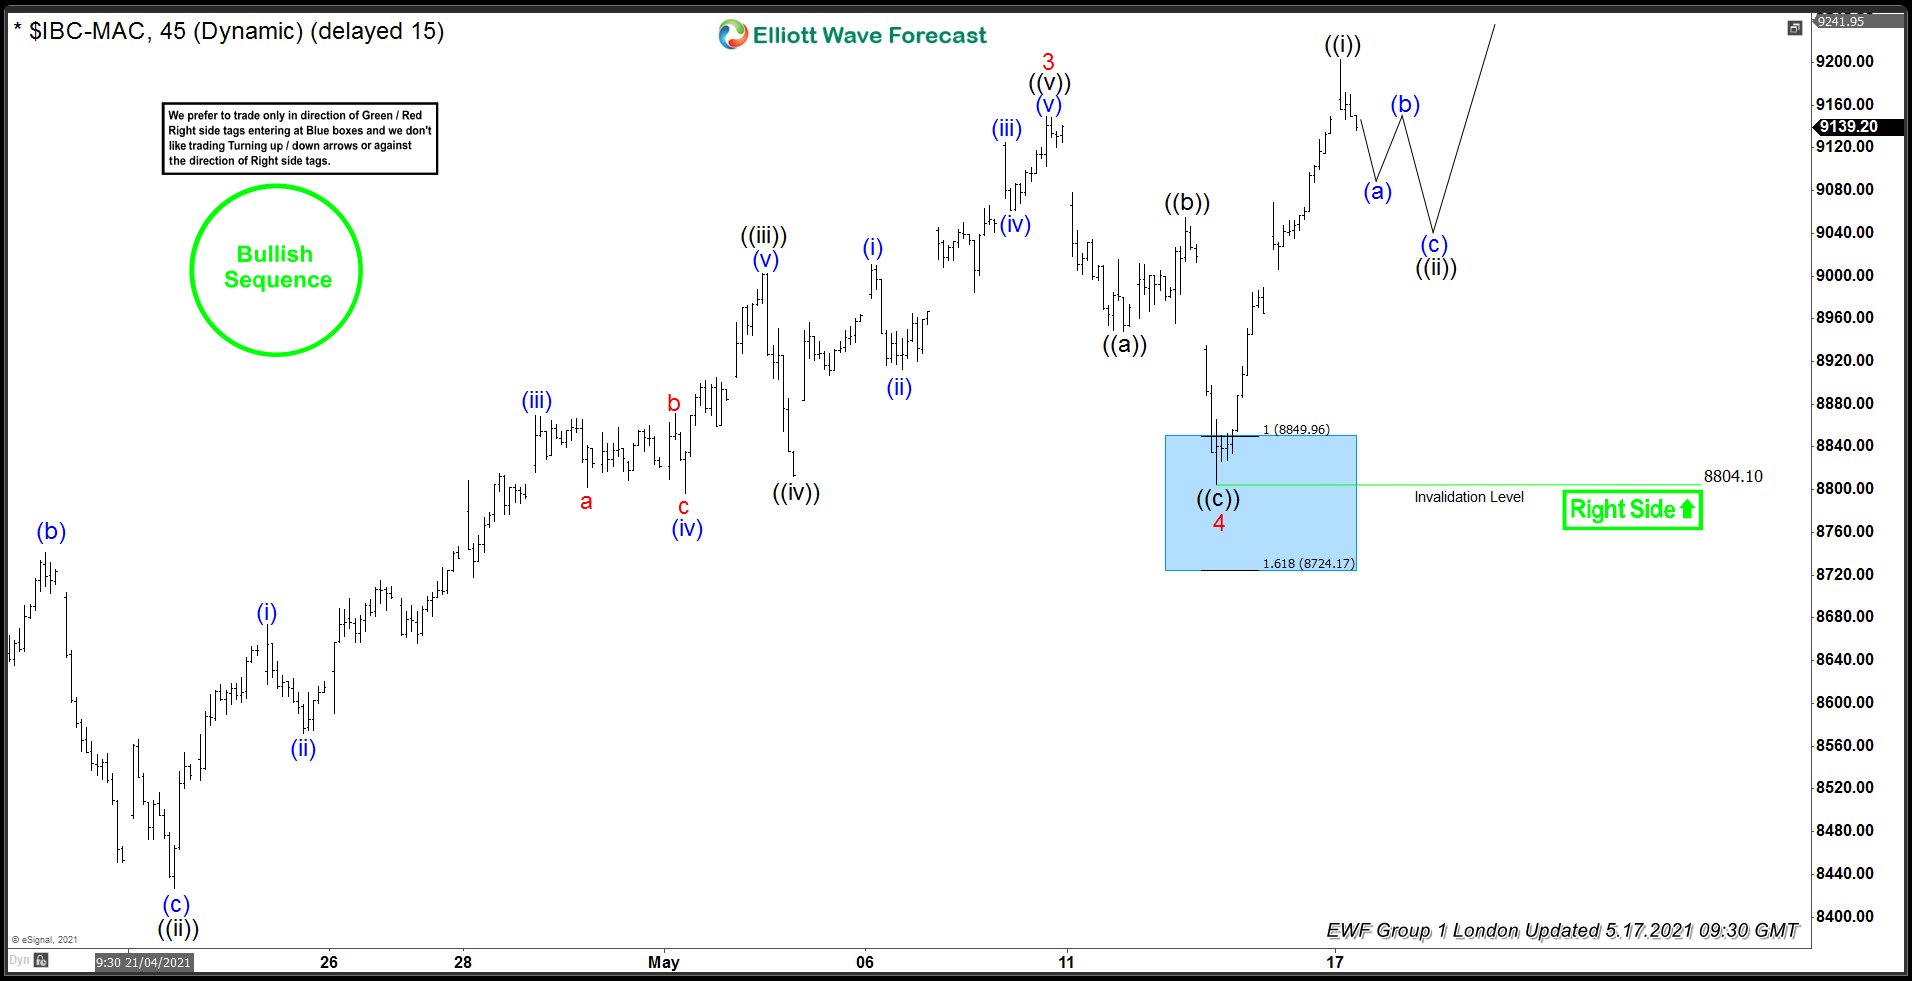
IBEX 1 Hour Elliott Wave Analysis 5.17.2021
The index found buyers right at the blue box. We got nice rally from the buying zone, when the price break above previous peak. Break above 3 red peak suggested next leg up is in progress. The index is now bullish against the 8804.1 ow in first degree. Members who took longs at the blue box are enjoying profits in risk free trades.
Keep in mind that market is dynamic and presented view could have changed in the mean time. You can check most recent charts in the membership area of the site. Best instruments to trade are those having incomplete bullish or bearish swings sequences. We put them in Sequence Report and best among them are shown in the Live Trading Room.
Elliott Wave Forecast
Source: https://elliottwave-forecast.com/trading/ibex-buying-dips-blue-box-area/