
$FXC Canadian Dollar Trust Elliott Wave & Long Term Cycles
Firstly the FXC instrument inception date was 6/26/2006. The instrument tracks changes of the value of the Canadian dollar relative to the U.S. dollar. It increases in value when the ‘loonie’ strengthens and declines when the dollar appreciates. In January 2002 the USDCAD forex pair made an all time high at 1.6184. Then it saw a decline into the November 2007 lows at .9059 where it is thought to have ended correcting the cycle up from the all time lows. That translates to the 113.02 price high from November 2007 in FXC. This is where the analysis begins on the FXC monthly chart shown below. The analysis continues below the FXC Monthly chart.
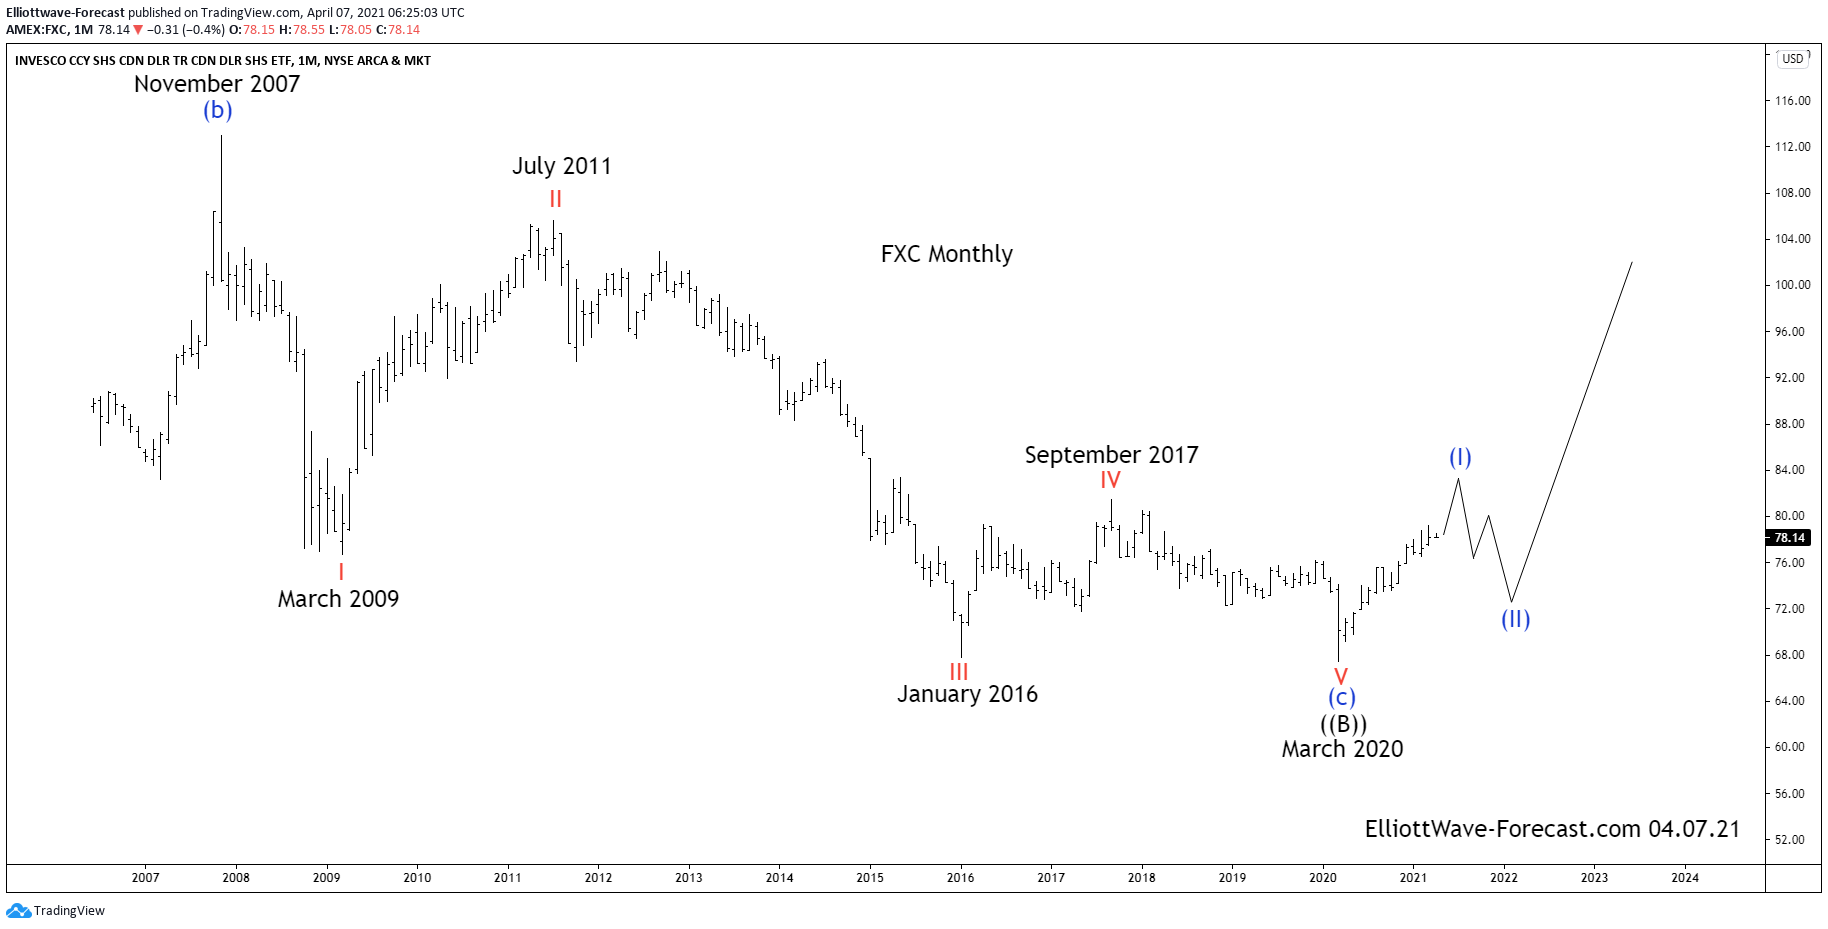
Secondly as previously suggested the FXC instrument mirrors USDCAD price highs and lows inversely. The decline from the November 2007 highs in FXC appears to be a complete Elliott Wave five wave impulse although it does have some price overlap as would a diagonal. The wave III ended in January 2016 then saw a zig zag wave structure in wave IV that ended in September 2017 correct the cycle from the July 2011 wave II highs.
In conclusion: As the chart suggests, the instrument appears ended a larger cycle lower in wave V of (C) to complete a flat wave ((B)) in March 2020. The bounce from there can be corrected at any time however as of this point in time it appears incomplete and can see some further strength toward the 83 to 84 area before it corrects the cycle up from the March 2020 lows. While above the March 2020 lows it should resume higher again.