
Credit Suisse is a global wealth manager, invetsment bank and financial services provider. It is one of the nine bulge bracket banks. Founded 1856 and headquartered in Zurich, it can be traded under tickers $CSGN at Six Swiss Exchange and $CS at New York Exchange. After printing the all-time highs in August 2000 at 89.38, the stock price has lost more than 90% by March 2020. Currently, we see Credit Suisse turning higher.
Credit Suisse Monthly Elliott Wave Analysis 02.07.2021
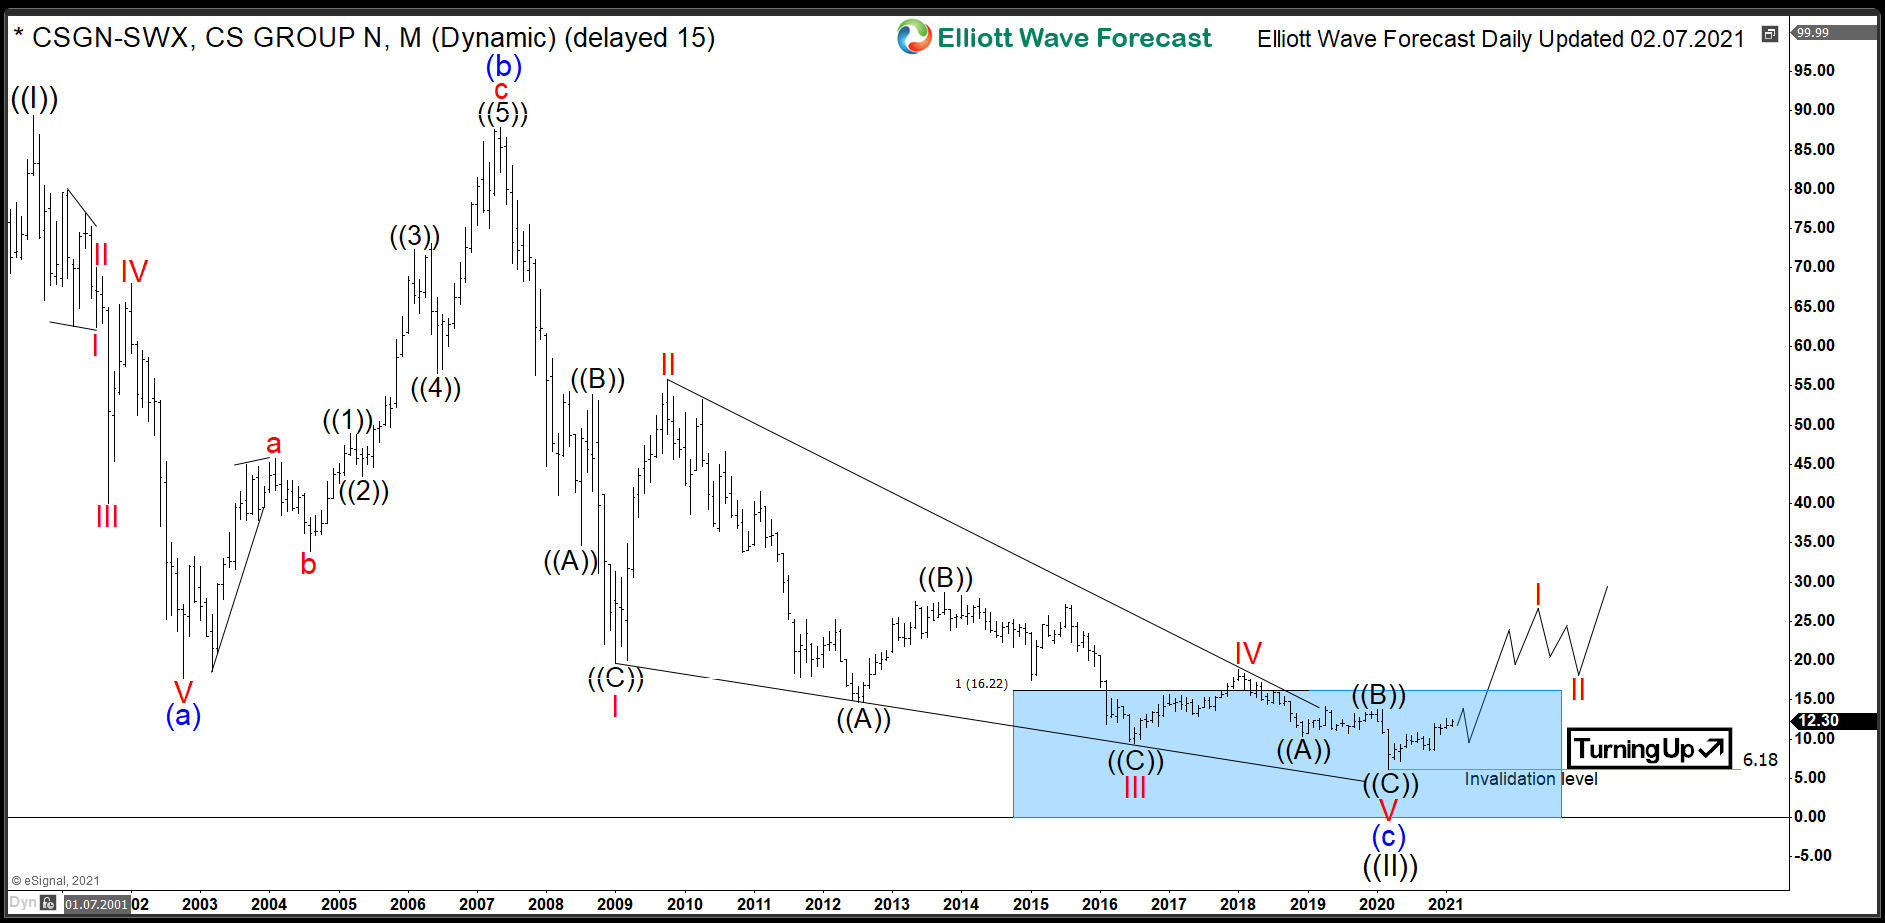
The monthly chart below shows the Credit Suisse stock $CSGN traded at Six Swiss. From the lows, the stock price has developed a cycle higher in wave ((I)) of a grand super cycle degree. Credit Suisse has printed the all-time highs in August 2000 at 89.38. From there, a correction lower in wave ((II)) has started with a first leg unfolding as a leading diagonal. The 5 subwaves of blue wave (a) lower have ended in October 2002 at 17.72. From the Elliott Wave theory one knows that five waves form an incomplete pattern. Hence, after a bounce, at least another leg lower should take place. Indeed, we saw a bounce in 3 waves of blue wave (b) failing below the all-time highs. Thereafter, a decline in wave (c) was expected to reach towards the equal legs extension area being 16.22-0.00 range.
As a matter of fact, the 16.22-0.00 target area has been reached by July 2012. Nothwithstanding, the stock was not ready to turn higher. Wave (c) of a zigzag pattern has taken the form of an ending diagonal which is an Elliott Wave 3-3-3-3-3 structure. Hence, Credit Suisse may end correction and start a new cycle upwards only once the pattern is accomplished. We call the pattern completed in March 2020 at 6.18. From there, the stock price should be in first stages of a new cycle in black wave ((III)). While above 6.18, Credit Suisse should extend towards the new all-time highs targeting the 95.66-150.98 area and even higher.
Credit Suisse Daily Elliott Wave Analysis 02.07.2021
The daily chart below shows the advance higher in black wave ((1)) of red wave I from the March 2020 lows. Within it, subwaves (1)-(4) have ended. Currently, wave (5) is in progress. Once over, a correction within wave ((2)) should take place. It is expected to find support in 3, 7, 11 swings above 6.18 lows. Investors and traders can be looking to buy the wave ((2)) pullback for a rally in wave ((3)).

Source: https://elliottwave-forecast.com/stock-market/credit-suisse-turning-higher/