
In this technical blog, we are going to take a look at the past performance of 4 hour Elliott Wave Charts of GDX, which we presented to members. In which, the rally to 05 August 2020 peak unfolded in an impulse structure. Down from there, GDX made a pullback lower to correct the cycle from the 16 March 2020 low. Also, the right side tag pointed higher & favored more strength. Therefore, we advised our members to buy the dips in GDX in 3, 7, or 11 swings at the blue box areas. We will explain the structure & forecast below:
GDX 4 Hour Elliott Wave Chart
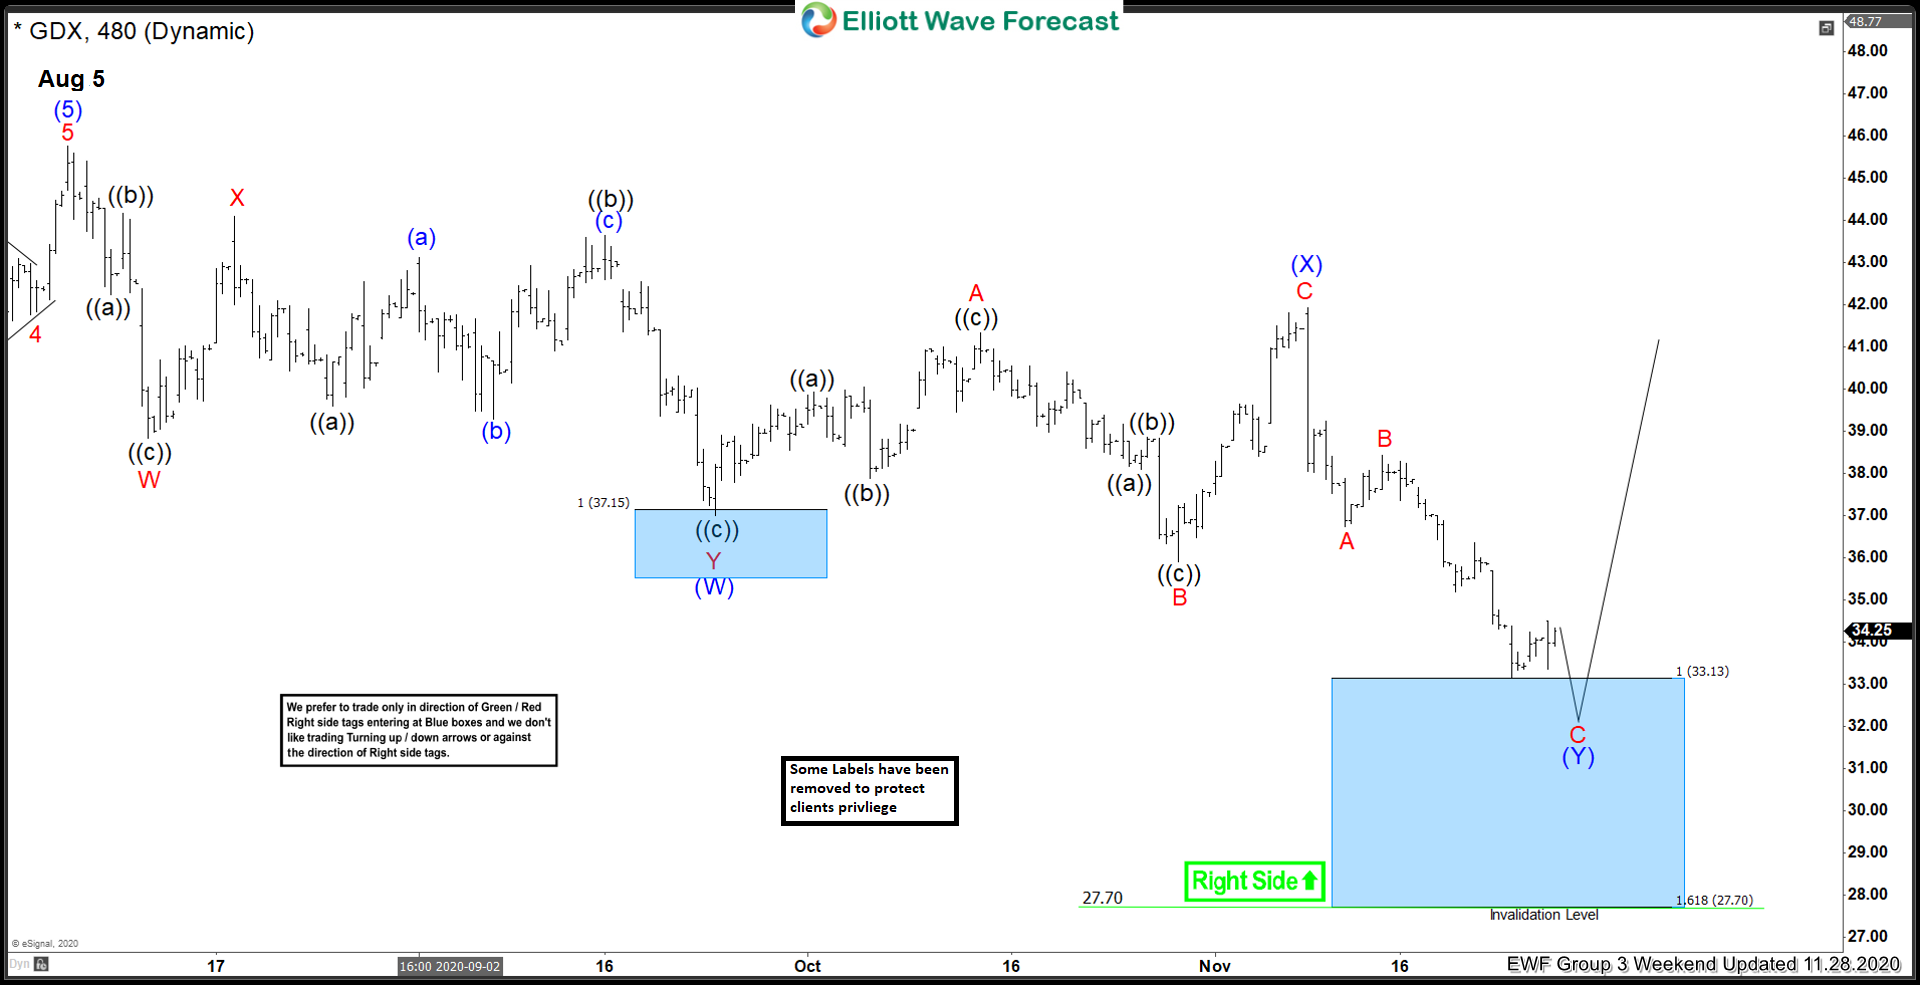
Above is the 4hr Elliott wave Chart of GDX from the 11/28/2020 weekend update. In which, the ETF made a pullback against the 16 March 2020 low. The internals of that pullback unfolded as an Elliott wave double three structure where wave (W) ended at $37 low. Up from there, the GDX made a bounce higher & ended wave (X) at $41.93 high as a lesser degree flat structure. Down from there, the GDX made a (Y) leg lower & managed to reach the $33.13- $27.70 100%-161.8% Fibonacci extension area of (W)-(X). From there, buyers were expected to appear looking for more upside or for 3 wave reaction higher at least.
GDX Latest 4 Hour Elliott Wave Chart
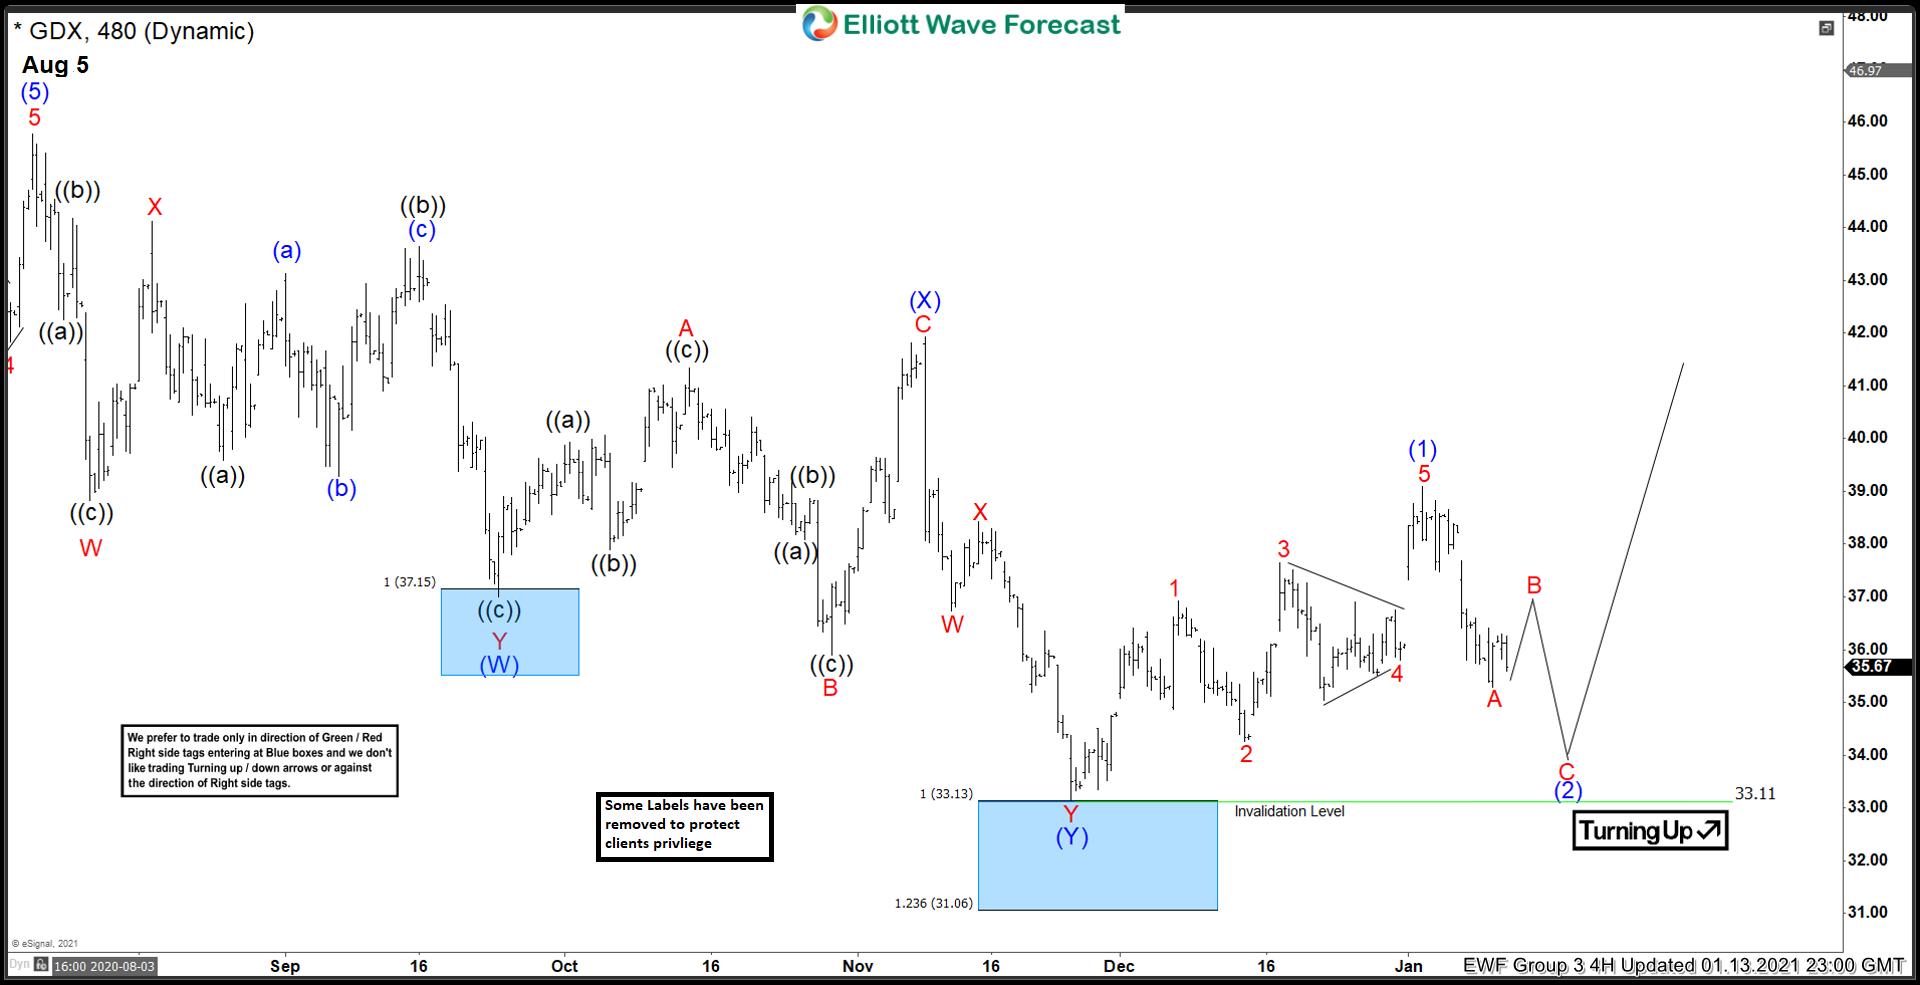
Here’s 4 hour Elliott Wave Chart from the 1/13/2021 update, in which the ETF showing a reaction higher from the blue box area at $33.13- $27.70. Allowed members to create a risk-free position in the last bounce shortly after taking the longs at the blue box area. However, a break above the 05 August 2020 peak ( $45.78) still needed to confirm the next extension higher & avoid double correction lower.
Source: https://elliottwave-forecast.com/stock-market/forecasting-bounce-higher-gdx/