
Hello fellow traders. In this technical blog we’re going to take a quick look at the charts of FTSE published in members area of the website. As our members know, FTSE is giving us pull back, correcting the cycle from the March low. The price structure from the June 8th peak is incomplete at the moment. It shows lower low sequences which makes it bearish against the 6298.8 peak. We advised clients to avoid buying the Index at this moment,while favoring short side from the Blue Box. In the charts below, we’re going to explain the Elliott Wave structure and trading setup.
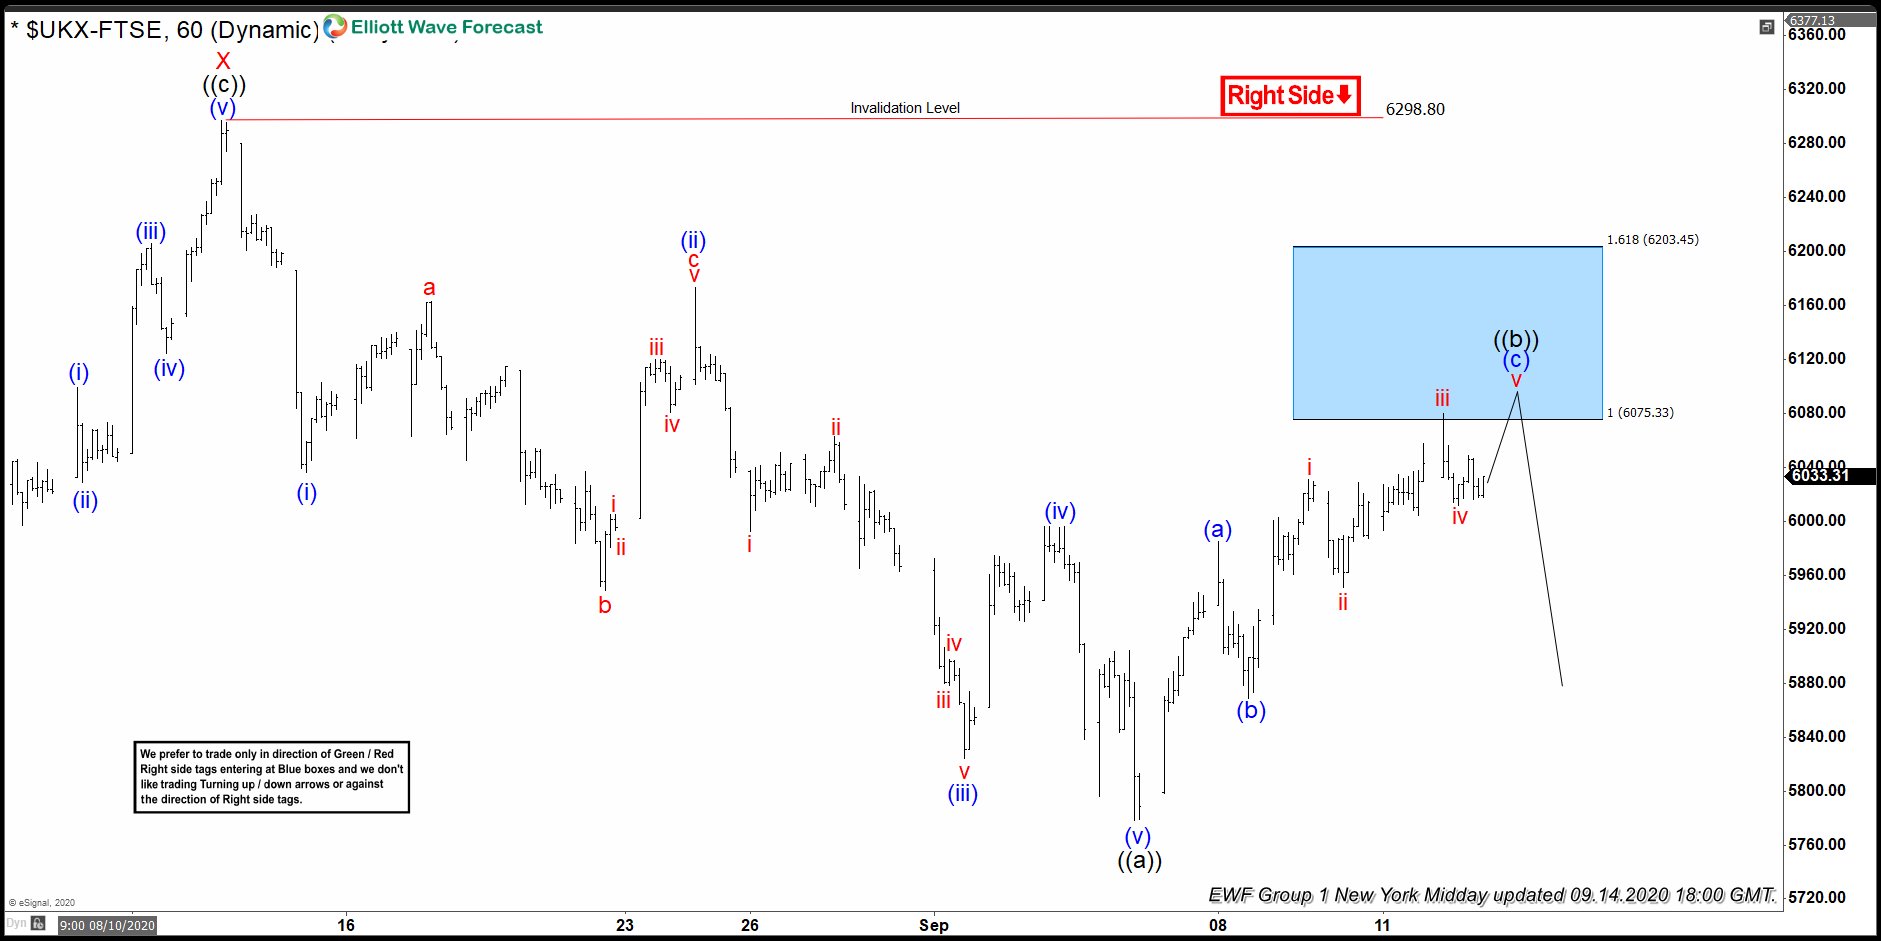
FTSE Elliott Wave 1 Hour Chart 9.14.2020
Current view suggests The Index is correcting the cycle from the 6298.8 peak. Recovery is having form of Elliott Wave Zig Zag Pattern that should ideally complete at 6075.33-6203.45 . Correction is incomplete at the moment, we expect another marginal push up to complete 5 waves in (c) leg. However we should be aware that sellers zone is already reached at 6075.33 and turn can happen any moment . At the Blue Box area we expect sellers to appear for decline toward new lows or 3 waves pull back at least. Invalidation of the sell trade would be break above 1.618 fib extension: 6203.45. Once the price reaches 50 fibs against the (b) blue low, we should make short positions risk free.As our members know Blue Boxes are no enemy areas , giving us 85% chance to get a bounce.
You can learn more about Elliott Wave Zig Zag Patterns at our Free Elliott Wave Educational Web Page.
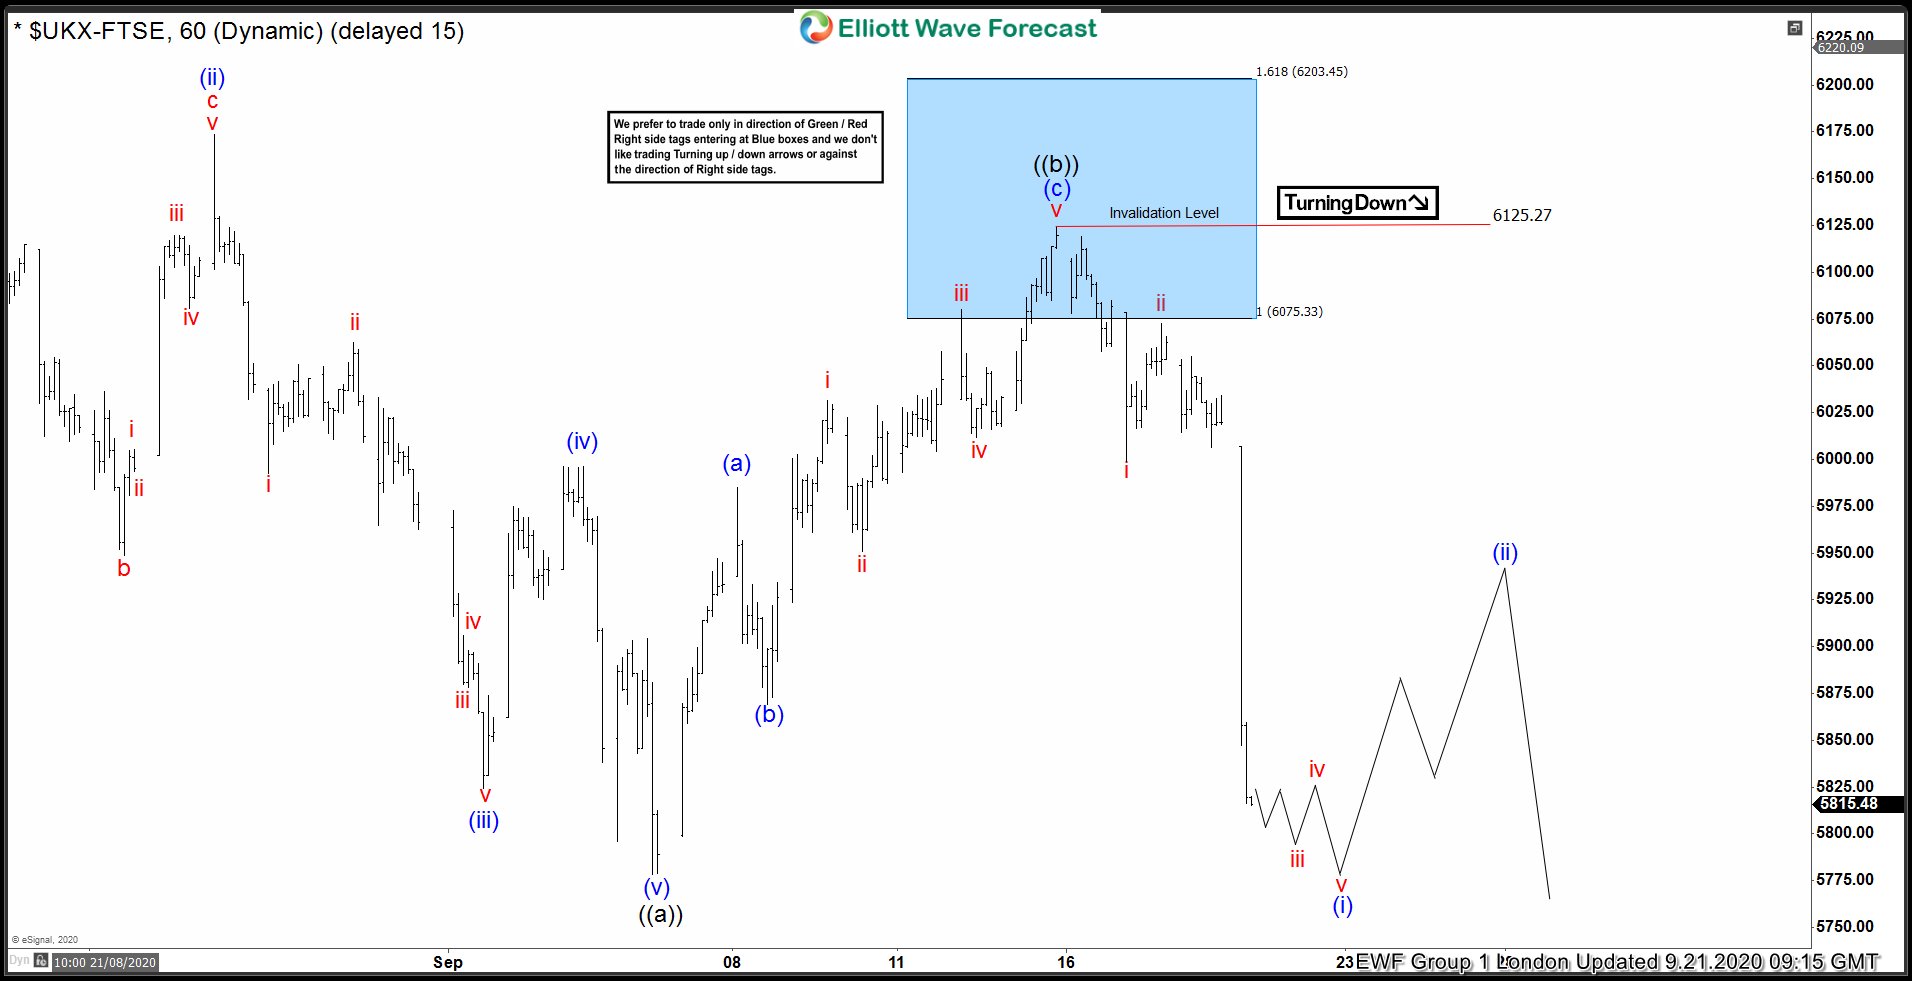
FTSE Elliott Wave 1 Hour Chart 9.14.2020
Eventually FTSE gave us another leg up within blue box as expected and complete 5 waves in (c) blue leg. It found sellers right at the blue box area : 6075.33-6203.45 and gave us nice decline from there . At this stage we see wave ((b))) recovery completed at the 6125.8 peak. However it needs to make break of 09/04 low to confirm next leg down is in progress. Members who sold the index are enjoying profits in risk free positions .
Keep in mind market is dynamic and presented view could have changed in the mean time. You can check most recent charts in the membership area of the site. Best instruments to trade are those having incomplete bullish or bearish swings sequences.We put them in Sequence Report and best among them are shown in the Live Trading Room.
Elliott Wave Forecast