Archer-Daniels-Midland company, commonly known as ADM, is a multinational food processing and commodities trading corporation. Founded 1902, headquartered in Chicago and traded under the ticker $ADM at NYSE, it is a component of the S&P500 index. First of all, ADM is engaged in corn and oilseeds processing. In general, the products are oils and meals from soybeans, wheat flour, cocoa, sunflower seeds, canola, flaxseeds, peanuts and many others. As a matter of fact, it operates more than 270 plants and 420 crop procurement facilities worldwide. Currently, we can see that the wheat prices are turning up. Also, other grains and soft commodities may be turning higher after years of a heavy devaluation. Therefore, an investment in shares of an agriguctural company can provide an exposure to the rising prices in this segment. Hereby, ADM as a market leader should become an excellent investment candidate.
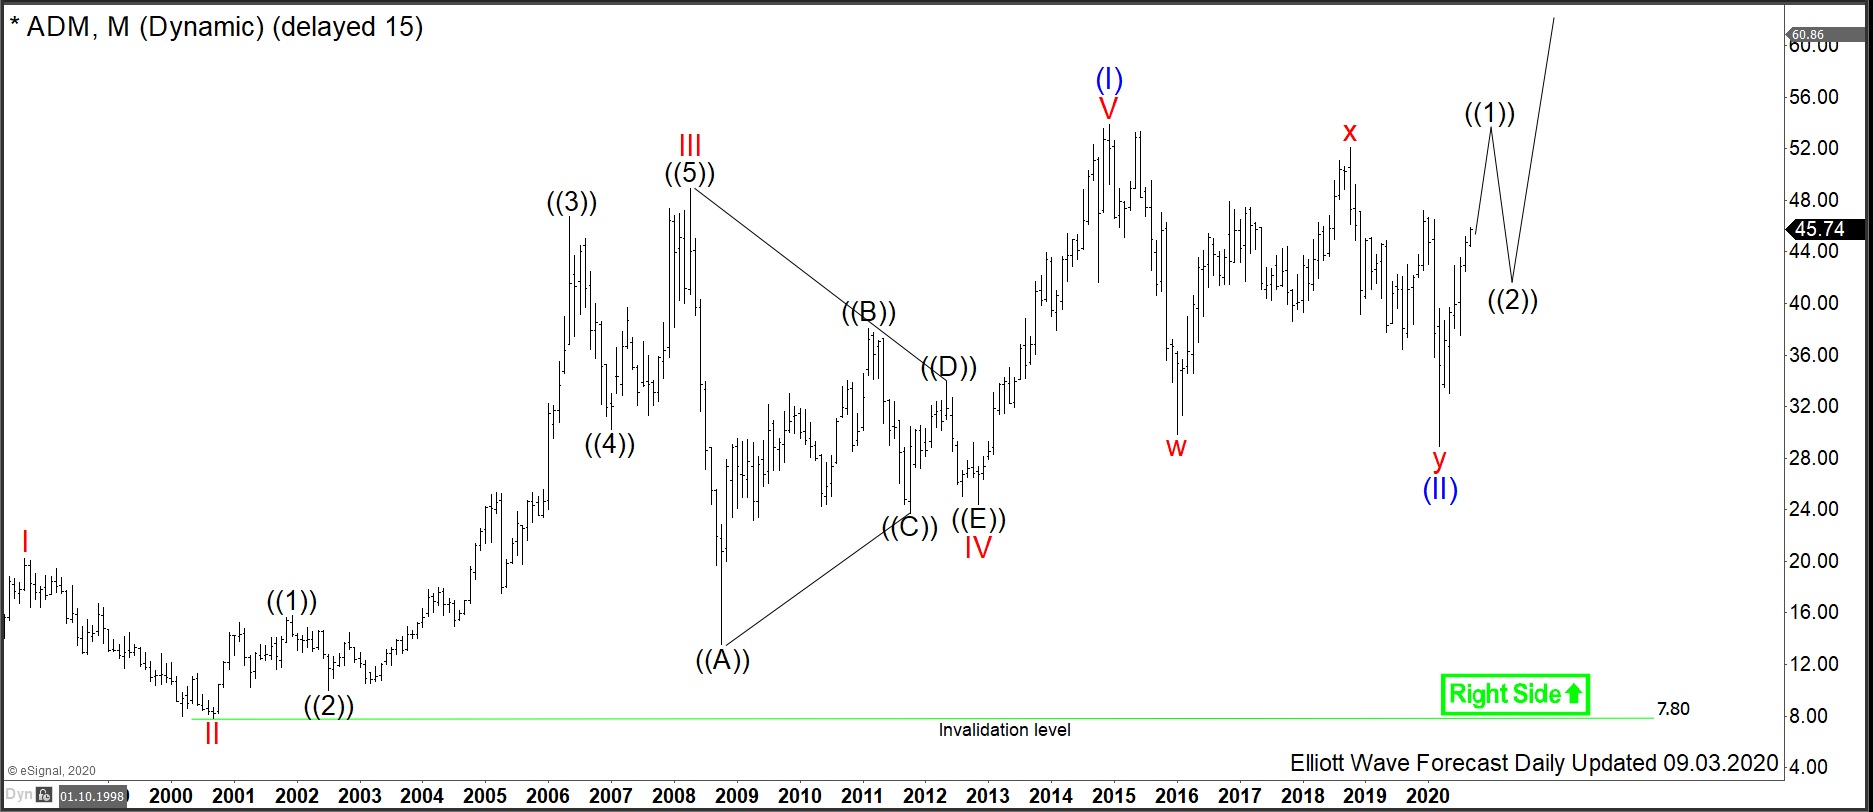
ADM Monthly Elliott Wave Analysis 09.03.2020
The monthly chart below shows the ADM shares $ADM traded at New York Stock Exchange. From the all-time lows, the stock price has developed a cycle higher in wave (I). Hereby, ADM has printed the all-time highs in December 2014 at 53.91. Within the impulsive advance in wave (I), all the internals I, III and V are impulsive waves, too. While the wave II is a straightdown correction, the wave IV can be seen as a contracting triangle pattern. From the 2014 highs, a correction lower in wave (II) has unfolded as a double three correction being a 3-3-3 structure. It has found its bottom in March 2020 at 28.92.
From the March lows, a new cycle in wave (III) may have started to the new highs. Break of 53.91 would confirm that. As right now, the price is turning higher in a black wave ((1)). Once finished, pullback in wave ((2)) should find support in 3, 7, 11 swings above 28.92 lows for another extension higher in wave ((3)).
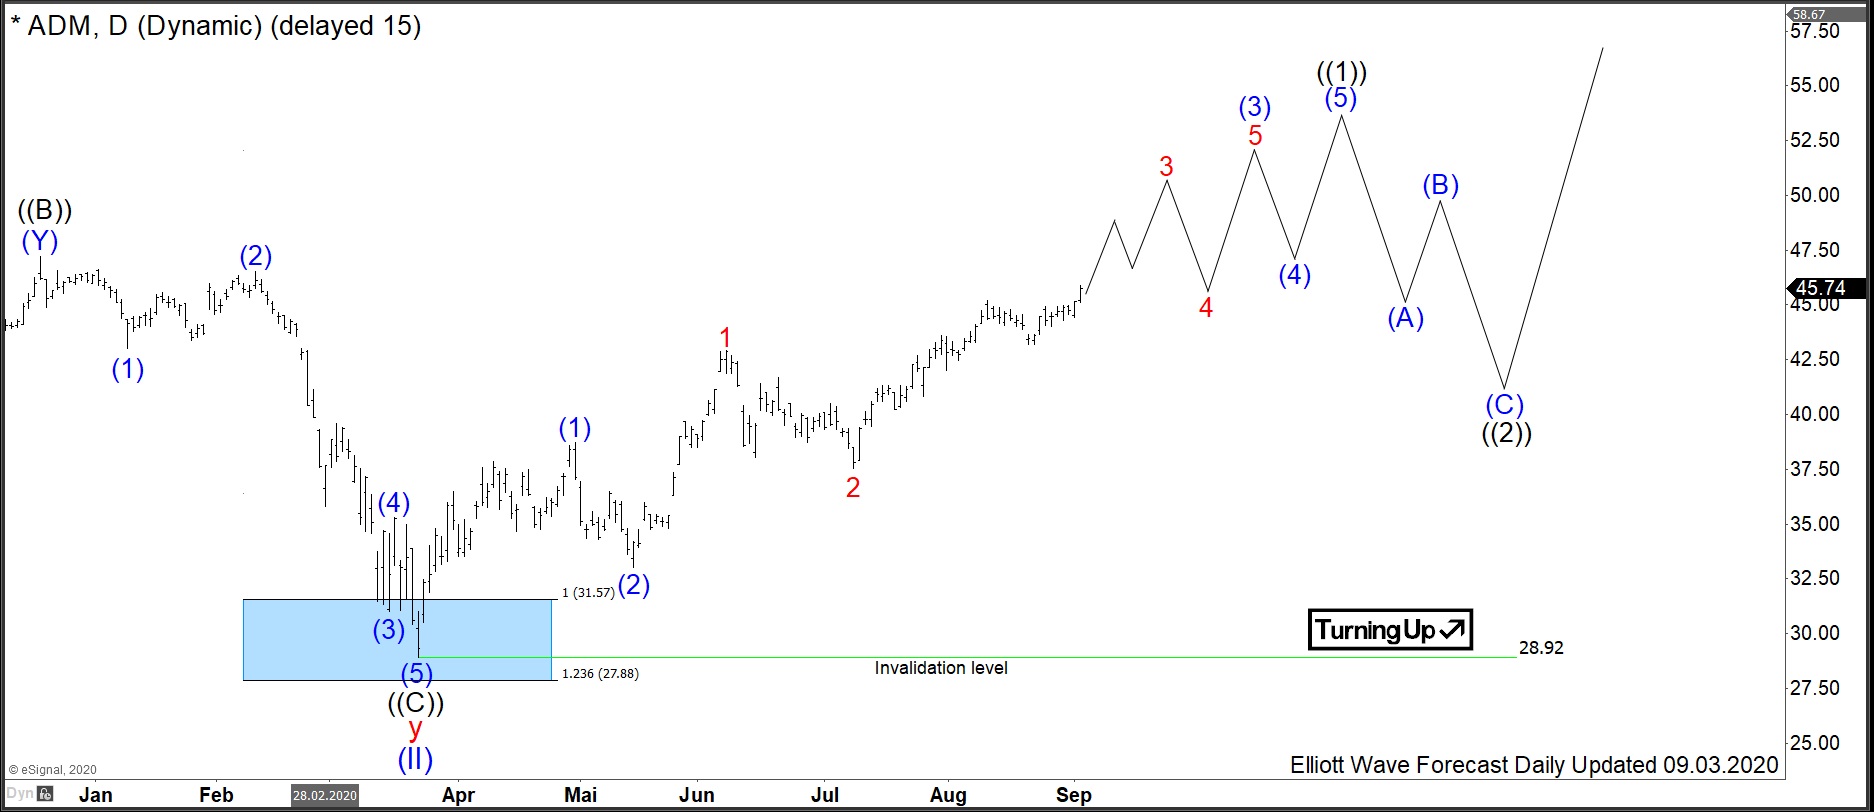
ADM Daily Elliott Wave Analysis 09.03.2020
The Daily chart below shows the $ADM shares price action in more detail. From the March lows at 28.92, the stock price has advanced in blue waves (1) and (2) of the black wave ((1)). Currently, from the May lows at 33.02, the wave (3) of ((1)) is unfolding higher. Right now, the ADM stock is pushing to new highs in red wave 3 of blue wave (3). Expect the prices to see more upside. Later on, two new highs in red wave 5 of (3) and blue wave (5) should happen. Once the march cycle in wave ((1)) has finished, expect a pullback in wave ((2)) to find support in 3, 7 or 11 swings above 28.92 lows for a possible acceleration in wave ((3)).
As an outlook, the new cycle in blue wave (III) should bring the prices towards 53.91 highs and above. The target for wave (III) will be 82.77-116.08. At current price levels, investors in agriculture related markets have a good opportunity to enter the market with a great potential to the upside.