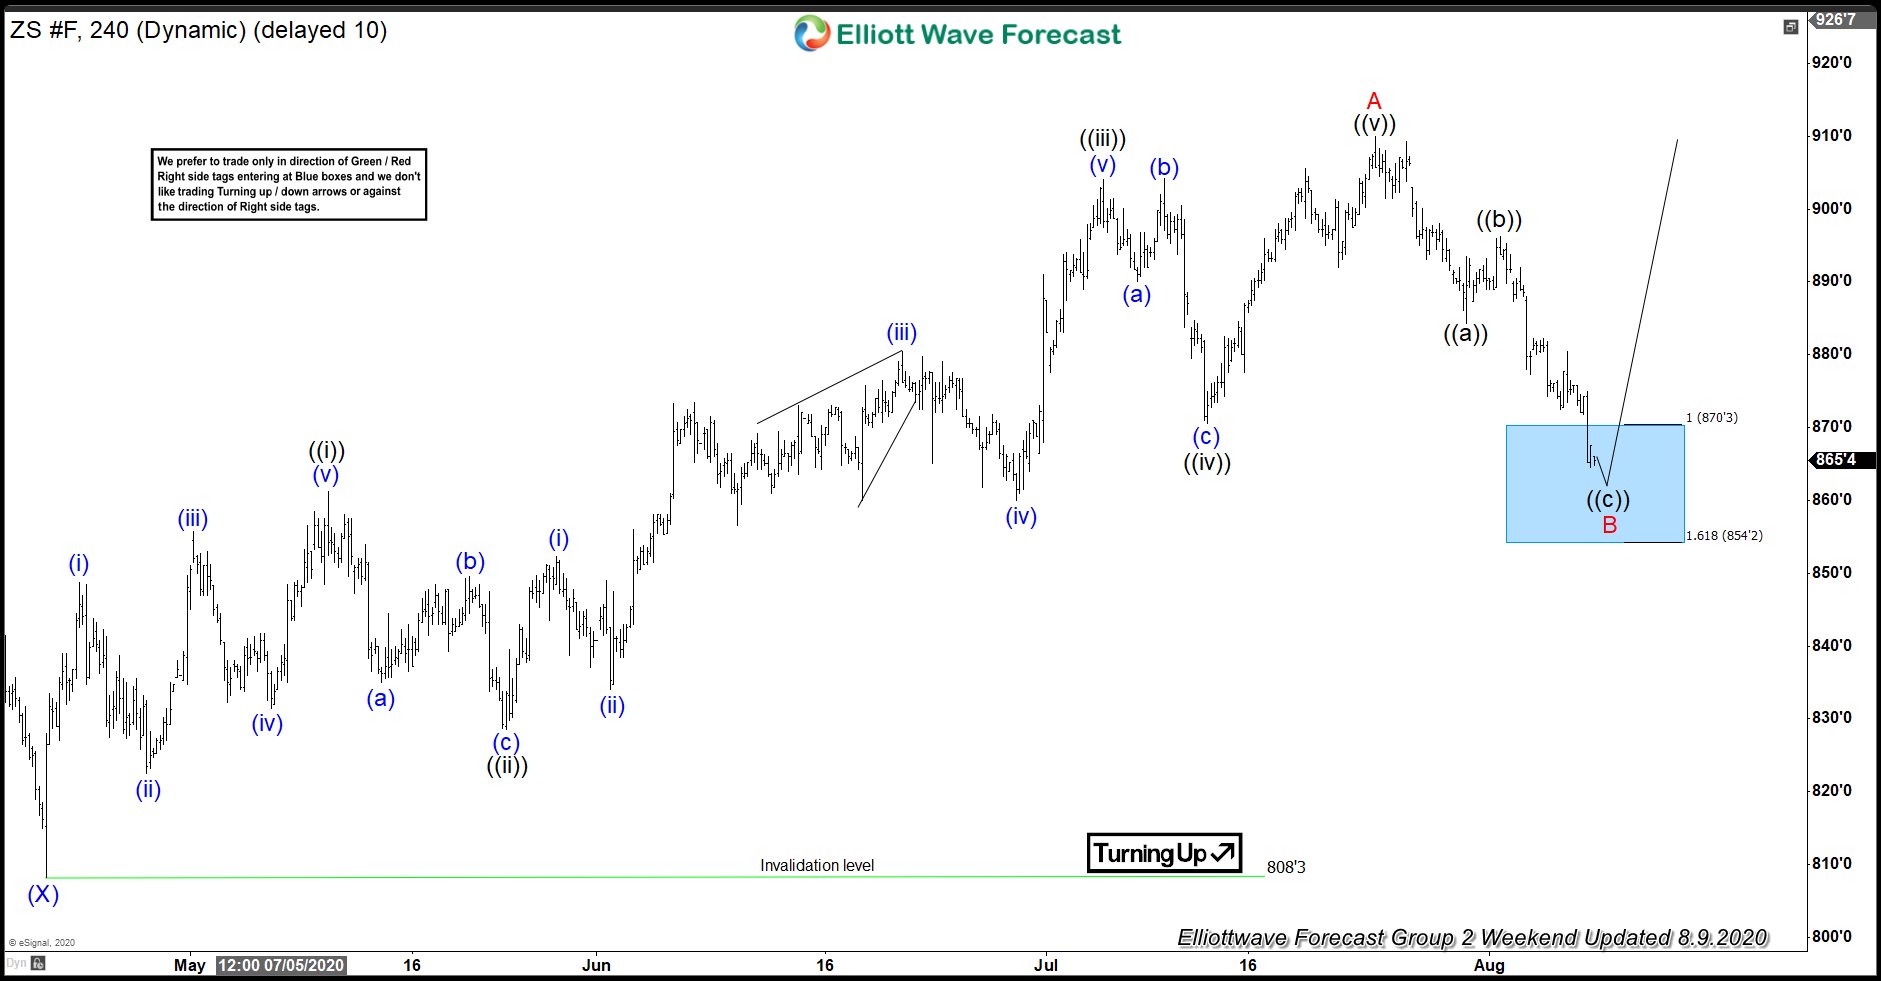
In this blog, we are going to take a look at the Elliott Wave chart of ZS_F (Soybean Futures). The 4 hour chart update from August 9 shows that Soybean has ended the cycle from April 21 low as wave A at 910 high. The sub-waves of the rally unfolded as 5 waves impulsive structure. Elliott Wave theory dictates that 3 waves pullback should happen afterwards before the rally continues. Soybean then did a pullback in wave B, which unfolded as a zigzag correction. Down from wave A high, wave ((a)) ended at 884.2 low. The bounce in wave ((b)) ended at 896.2 high. The commodity then declined lower in wave ((c)). The pullback reached the 100-161.8% extension of wave ((a))-((b)). That area is highlighted with a blue box. As long as 161.8% extension stays intact, soybean is expected to see 3 waves bounce at least or resume the rally higher from blue box.
ZS_F 8.9.2020 4 Hour Elliott Wave Chart
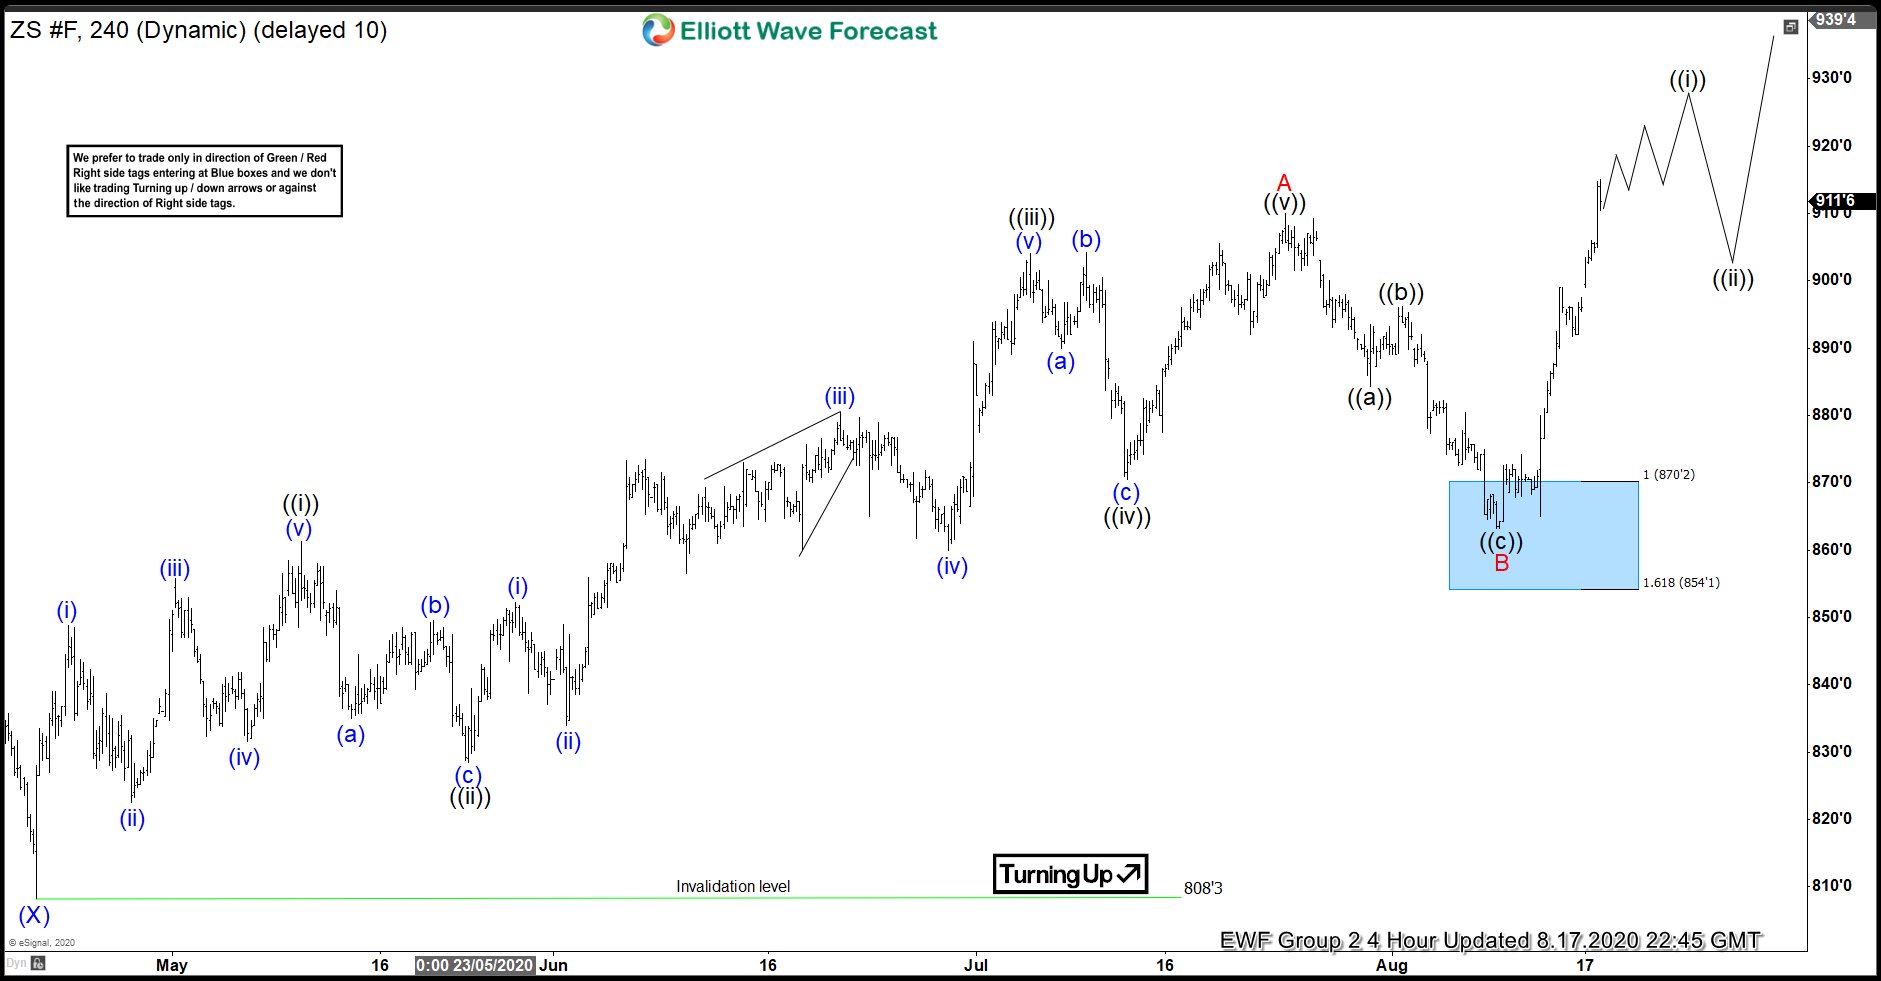
The 4 hour chart update from August 17 shows that soybean ended wave ((c)) at 863.2 low. This also ended wave B in higher degree. From there, the commodity has extended higher. The rally from blue box has broken above previous wave A high, confirming that wave B is in place and the next leg higher in wave C is already in progress.
ZS_F 8.17.2020 4 Hour Elliott Wave Chart
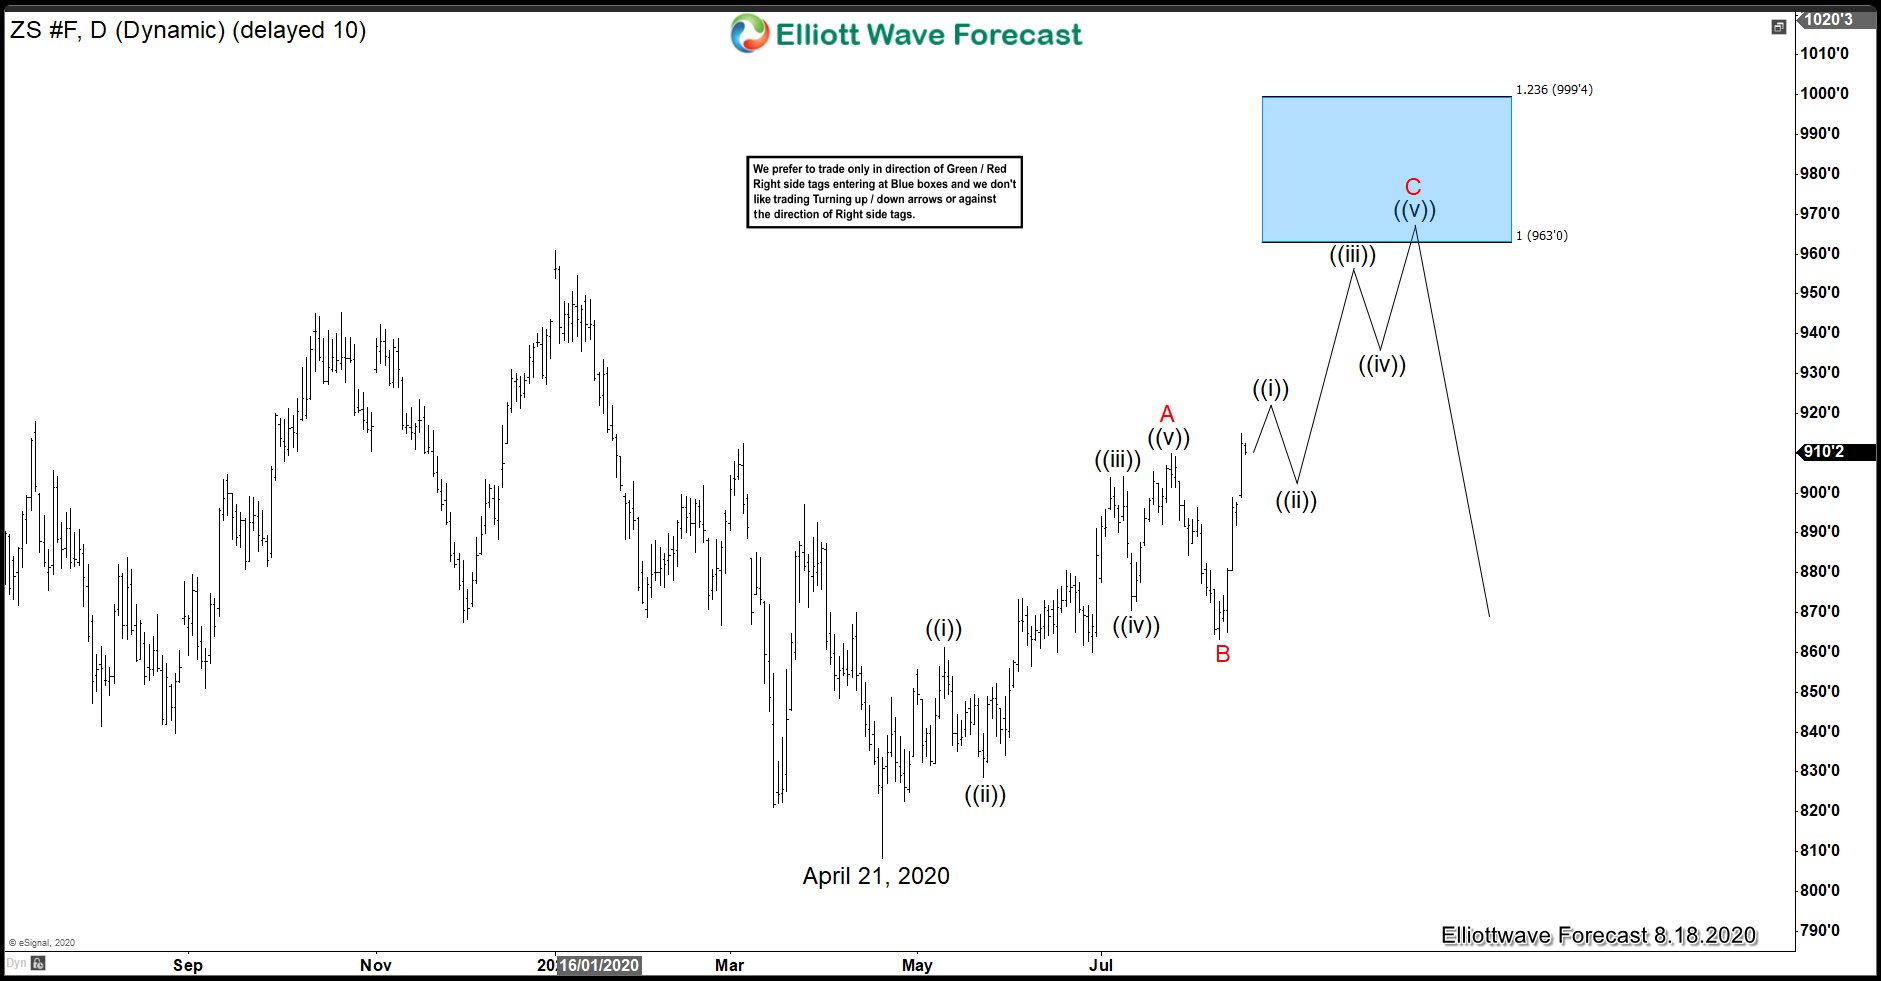
Since it has broken the previous wave A high, Soybean now is showing an incomplete sequence to the upside. The 100-123.6% extension of wave A-B where C can potentially end is between 963-999.4 area. As long as wave B low at 863.2 stays intact, expect dips in 3,7, or 11 swings to find support for more upside later targeting the blue box area.
ZS_F 8.18.2020 Daily Elliott Wave Chart