
In this technical blog we’re going to take a quick look at the Elliott Wave charts of COPPER ( $HG_F) published in the membership area of the elliottwave-forecast . As our members know, COPPER is showing impulsive sequences within the cycle from the March 1.974 low. We got 3 waves pull back , that unfolded as Elliott Wave Double Three Pattern. The pair reached Equal Legs – Blue Box and found buyers at that area as we expected. In further text we’re going to explain the forecast and Elliott Wave Pattern.
Before we take a look at the real market example, let’s explain Elliott Wave Double Three pattern.
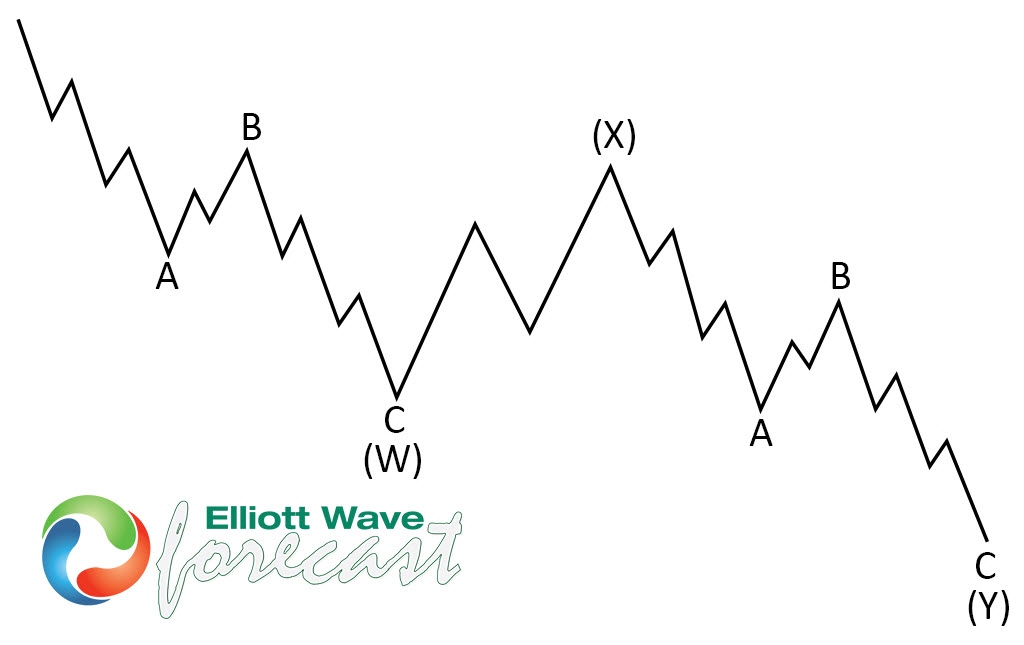
Elliott Wave Double Three Pattern
Double three is one of the most common pattern in the market these days, also known as 7 swing structure. It’s a very reliable pattern which is giving us good trading entries with clearly defined invalidation levels and target areas.The picture below presents what Elliott Wave Double Three pattern looks like. It has (W),(X),(Y) labeling and 3,3,3 inner structure, which means all of these 3 legs are corrective sequences. Each (W) and (Y) are made of 3 swings , they’re having A,B,C structure in lower degree.
You can learn more about Elliott Wave Double Three Patterns at our Free Elliott Wave Educational Web Page.
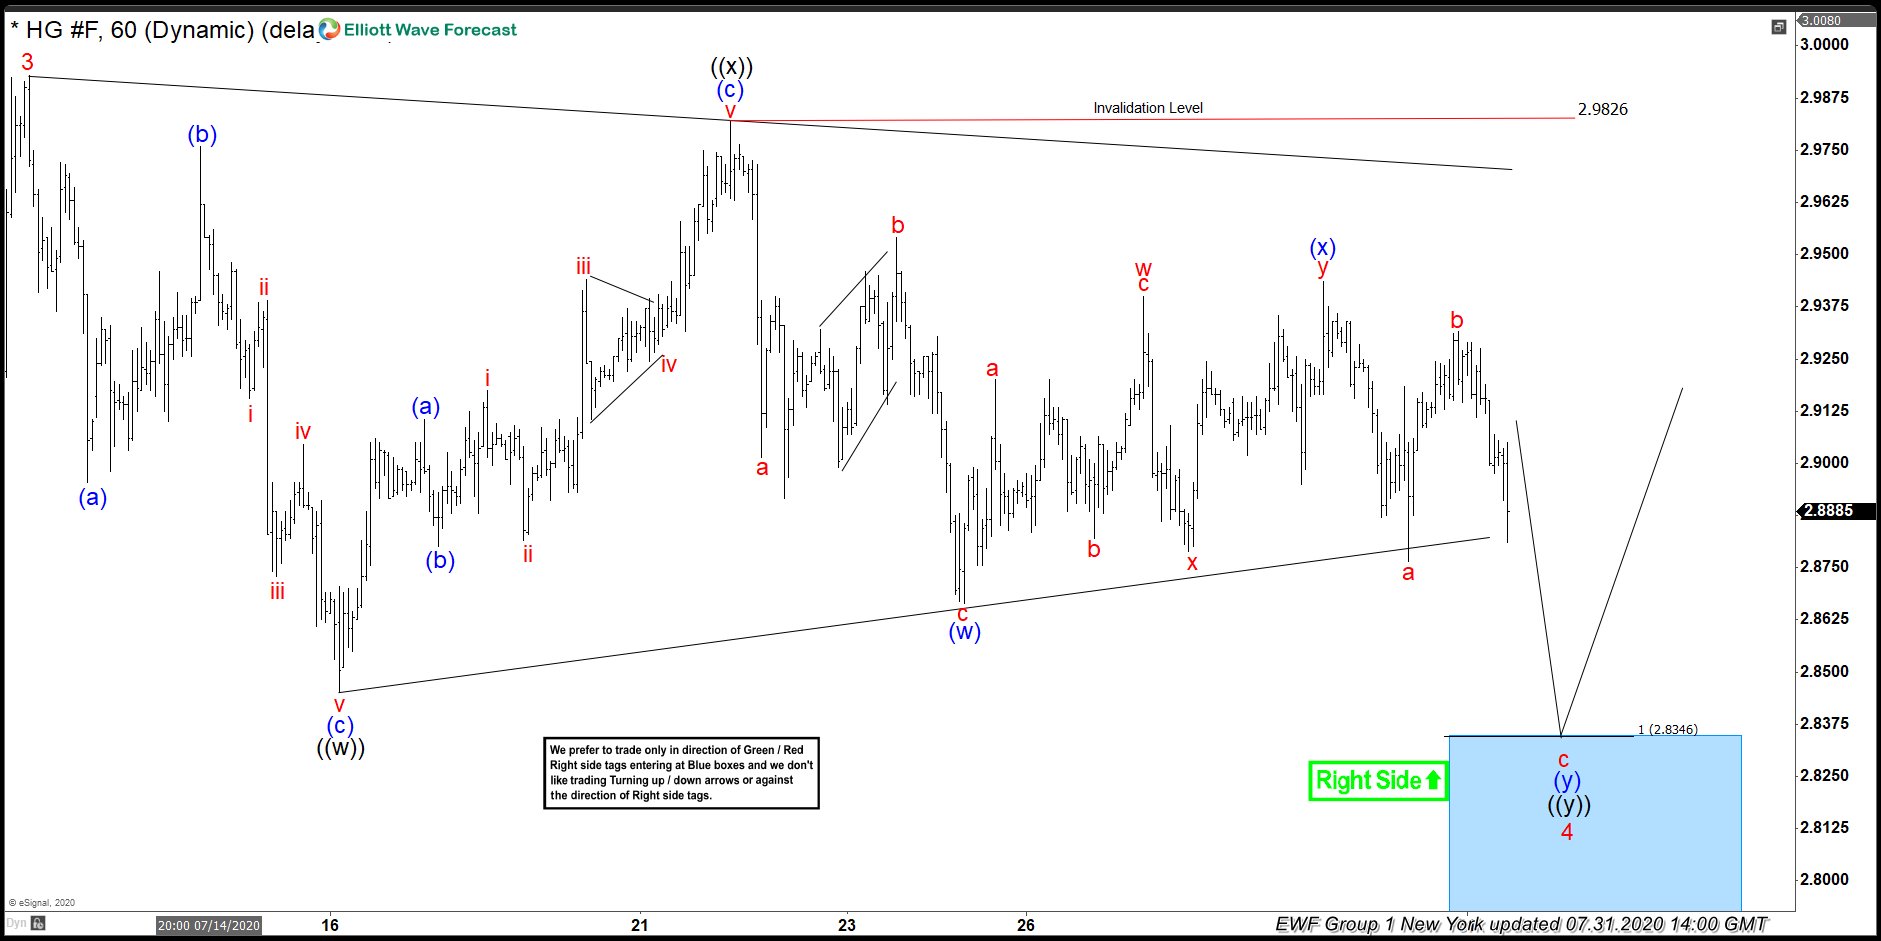
COPPER 1 Hour Elliott Wave Analysis 07.31.2020
COPPER wave 4 red pull back is unfolding as Elliott Wave Double Three Pattern. At this stage we assume that correction still incomplete. First leg of correction ((w)) ended as 3 waves, then we got 3 waves recovery labeled as ((x)) connector. As far as the price stays below (x) blue high and 2.9826 pivot holds. We expect to see another leg down toward 2.8346-2.752 ( buyers area ) which would be 7th swing down from the peak. At that area we expect buyers to appear for proposed rally or 3 waves bounce at least. We don’t recommend selling the commodity and would like to be buyers at the proposed blue box area. As our members know, Blue Boxes are no enemy areas , giving us 85% chance to get a bounce.
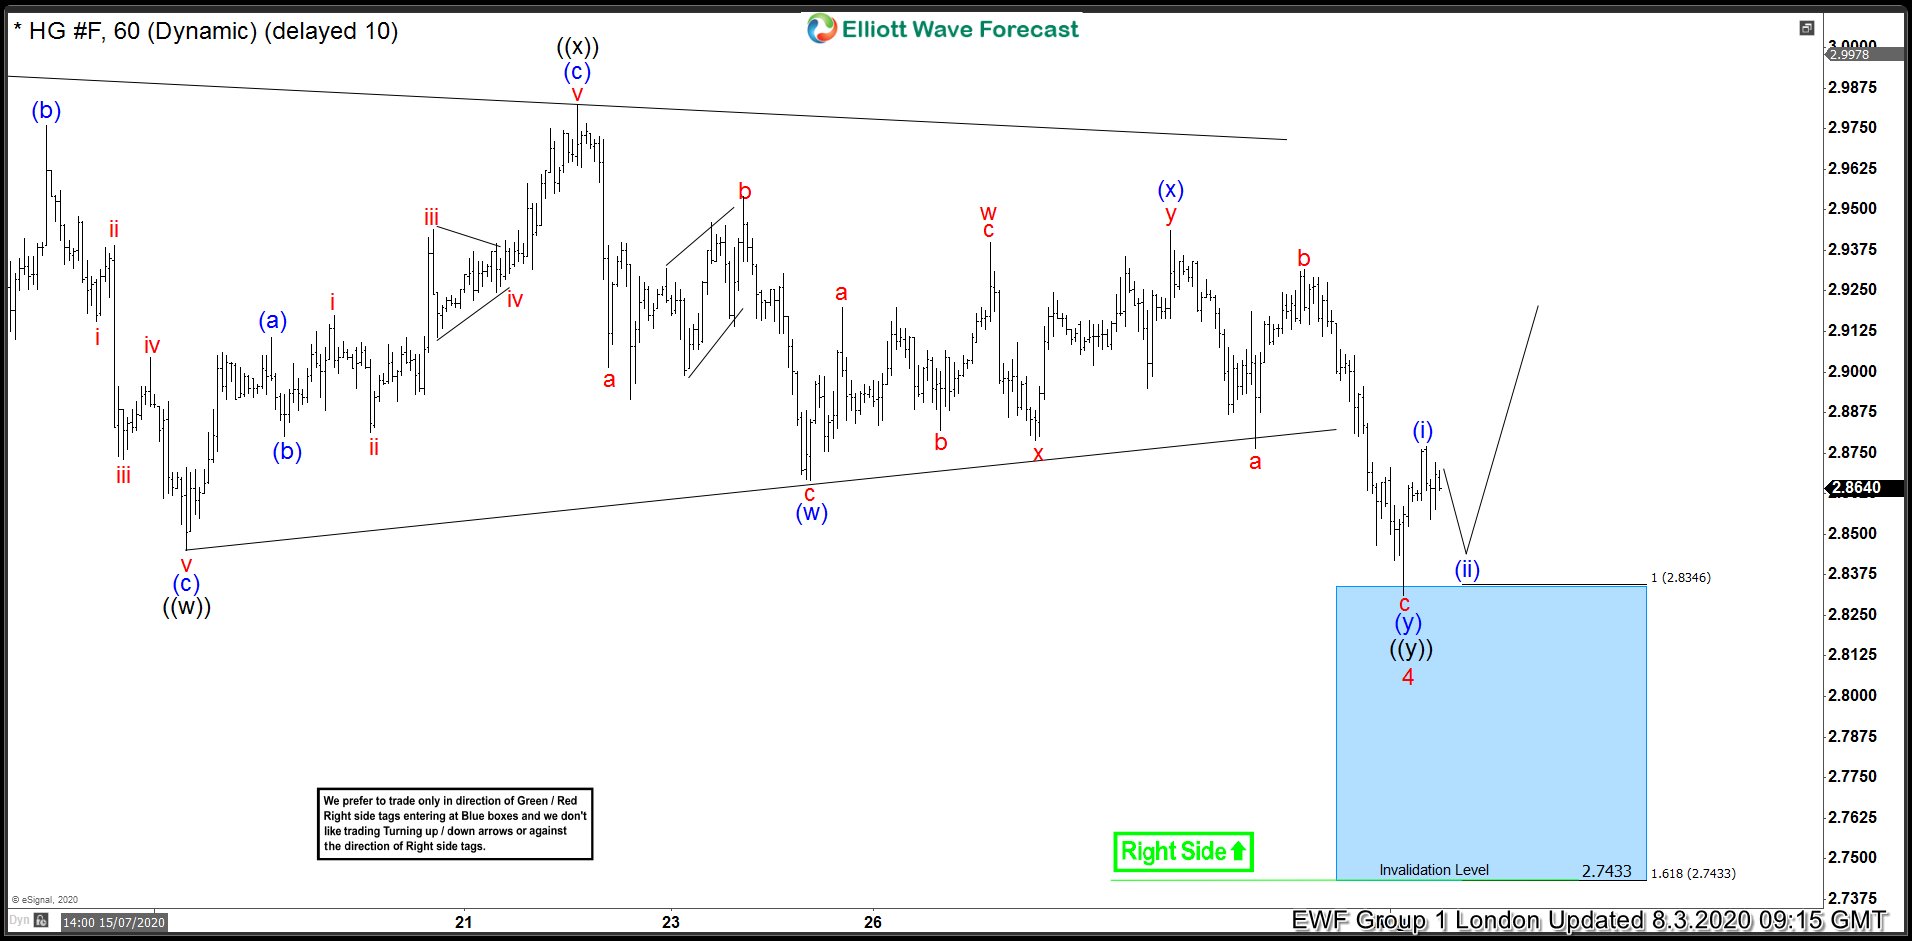
COPPER 1 Hour Elliott Wave Analysis 08.3.2020
COPPER made another leg down. The commodity found buyers right at the upper level of the 2.8346-2.752 ( Blue Box area). So far bounce is still shallow, but we see possibility that wave 4 pull back can be done at 2.8304 low. Last leg down ((y)) black also has corrective sequences. So we assume that 4 red pull back has Double Three structure.We need to see further separation from the lows. As soon as the price reach 50 fibs against the (x) blue high, we will make long positions risk free ( put SL at BE)
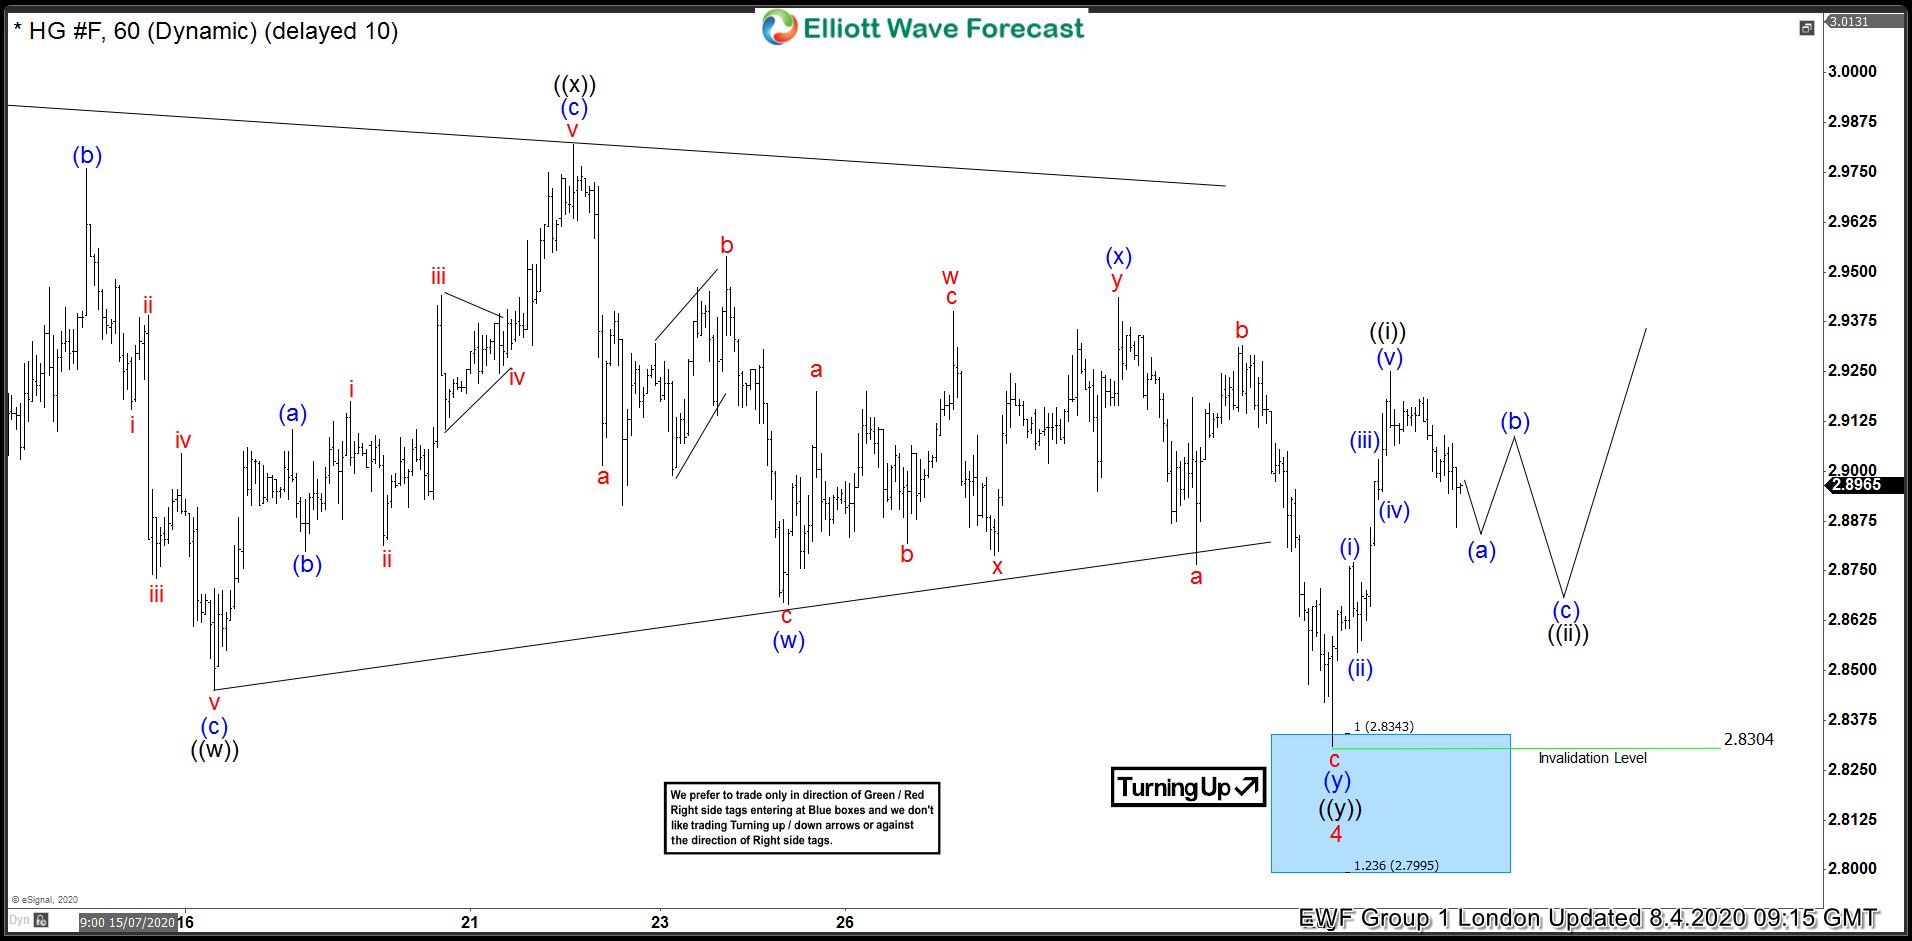
COPPER 1 Hour Elliott Wave Analysis 08.4.2020
Eventually we got separation higher as expected. Now all long positions are risk free. Current view suggests short term cycle from the 2.8304 low ended as 5 waves rally and now we’re correcting it. The price must stay above 2.8304 to keep this count valid. Otherwise deeper correction can be in progress. Once short term pull back ((ii)) black ends, we would like to see further rally and ideally break of 07/13 peak to confirm next leg up is in progress.
Keep in mind market is dynamic and presented view could have changed in the mean time. You can check most recent charts in the membership area of the site. Best instruments to trade are those having incomplete bullish or bearish swings sequences.We put them in Sequence Report and best among them are shown in the Live Trading Room.
Elliott Wave Forecast