Hang Seng 15 minutes chart below shows that the index has extended lower from July 7 peak. The decline is unfolding as a double three Elliott Wave Structure. From July 7 high, wave W ended at 25570.36 low. The bounce in wave X ended at 26103.84 high. The pair then extended lower in wave Y, which ended at 24766.17 low. This completed wave (W) in larger degree. The decline reached the blue box area, which is the 100 – 123.6% extension of wave W-X. From that blue box, the Index did a 3 waves bounce in wave (X), which ended at 25772.41 high. The bounce unfolded as zig-zag Elliott Wave Structure.
Afterwards, the Index continued its decline and broke below previous wave (W) low. This confirms that the next leg lower in wave (Y) is already in progress. Down from wave (X) high, the index extended lower in wave A and ended at 24526.91 low. Wave A low ended at 61.8-76.4% extension of wave (W)-(X). From there, the index is currently doing a bounce in wave B. While below 25772.41 high, the bounce in 3,7 or 11 swings is expected to fail. The index then can do another leg lower in wave C before ending wave (Y) in the larger degree. The 100-161.8% extension of (W)-(X) where (Y) can end is between 22486-23743 area.
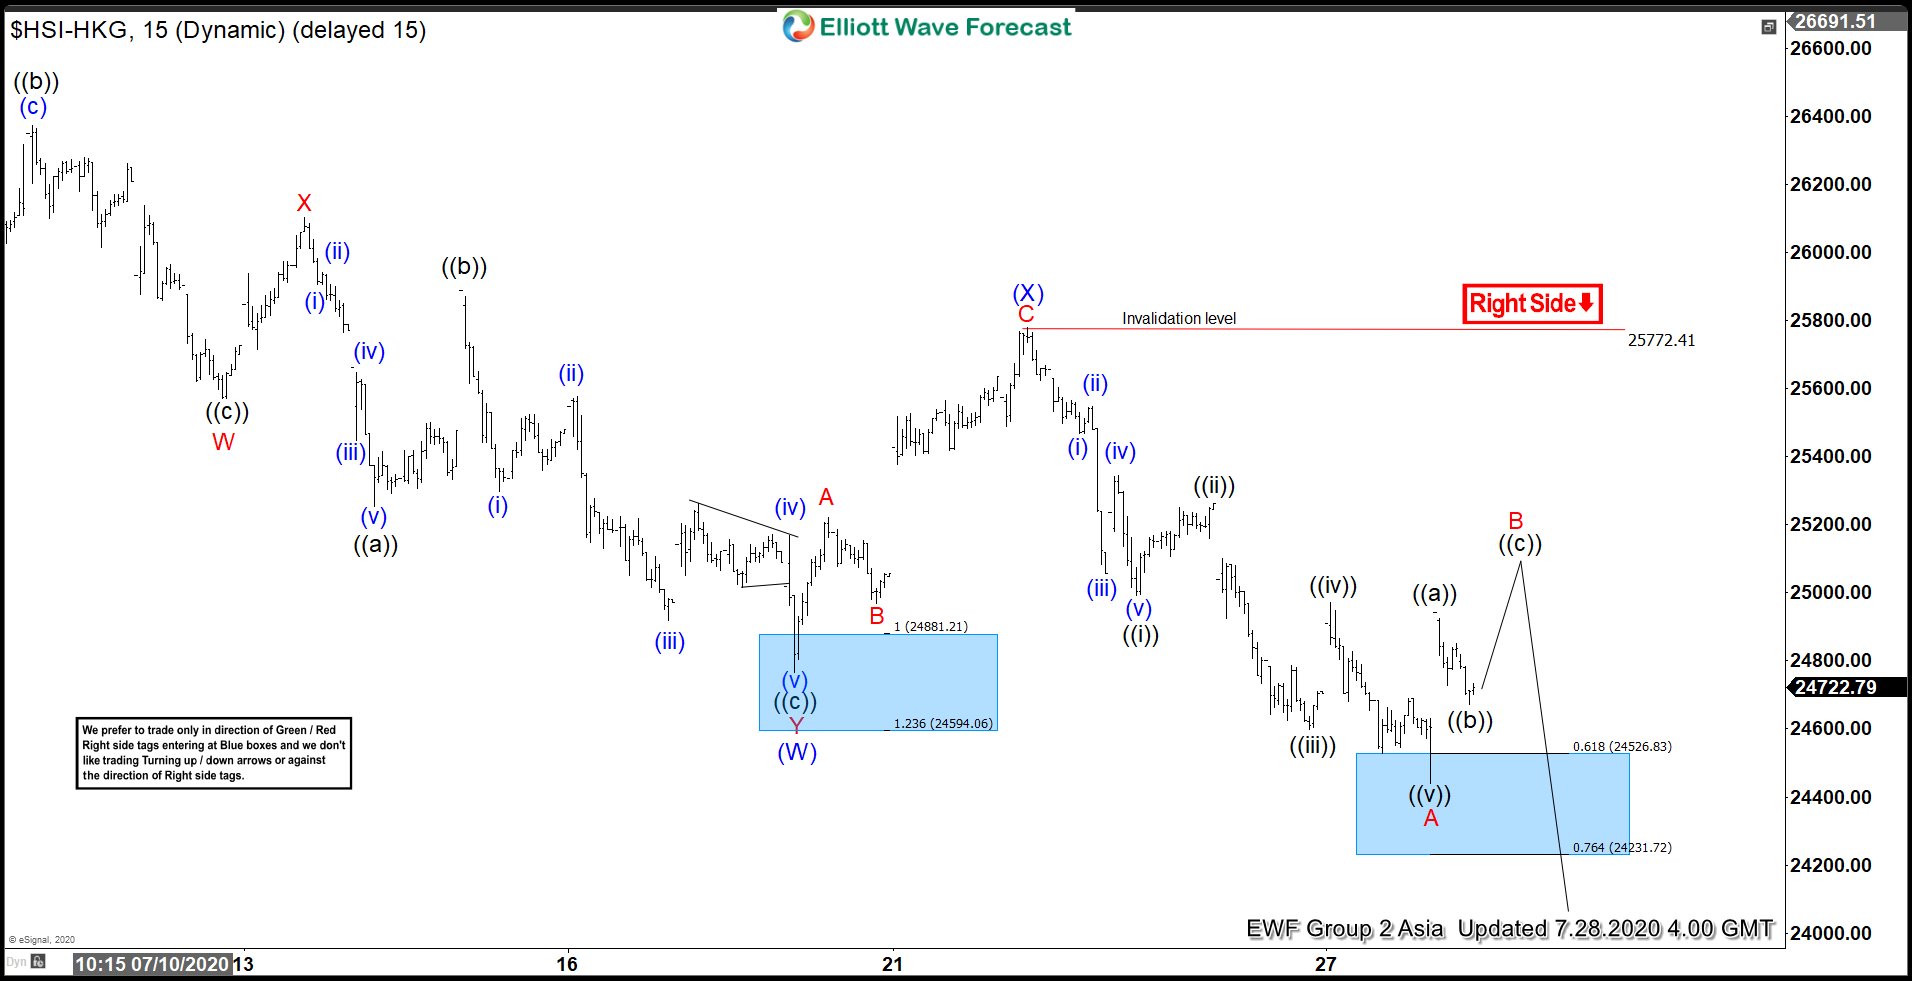
Hang Seng 15 Minutes Elliott Wave Chart