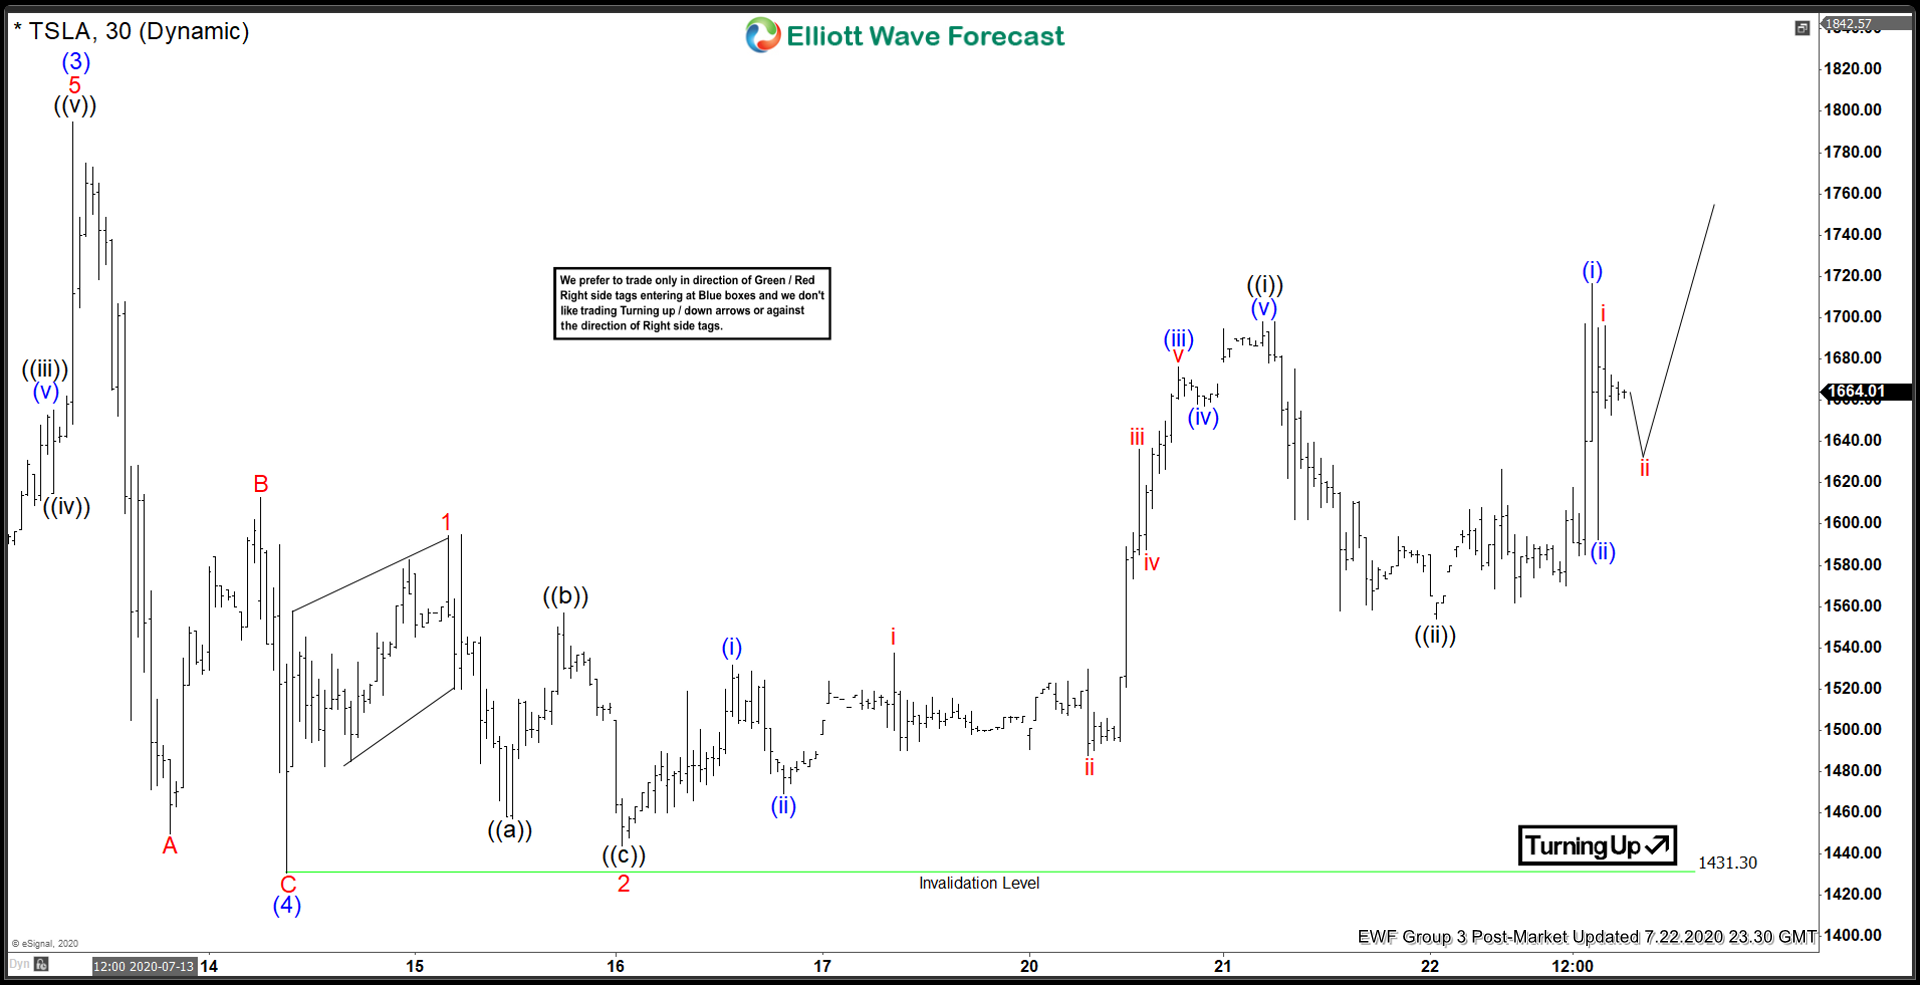
TSLA 30 minutes chart below shows that the stock has ended pullback from July 13 high in wave (4) at 1431.30 low. The correction unfolded as zig-zag Elliott Wave Structure. Wave A ended at 1450 low, wave B ended at 1612.87 high, and wave C ended at 1431.30 low. From there, the stock has resumed higher. Up from wave (4) low, wave 1 ended at 1594.56 high. The pullback in wave 2 ended at 1444.01 low. Currently wave 3 is in progress as the stock has broken above previous wave 1 high. Up from wave 2 low, the stock ended wave ((i)) at 1698 high. The internal subdivision of wave ((i)) unfolded as a 5 waves impulsive Elliott Wave Structure.
From wave 2 low, wave (i) ended at 1531.71 high. The dip in wave (ii) ended at 1469.26 low. Afterwards, the stock resumed higher in wave (iii), which ended at 1675.90 high. Wave (iv) pullback ended at 1657 low. The last push higher in wave (v) ended at 1698 high. This ended wave ((i)) in larger degree. From there, the stock did a pullback in wave ((ii)) which ended at 1553.90 low. Currently, wave ((iii)) of 3 has started. Wave (i) of ((iii)) ended at 1716.47 high and wave (ii) dip ended at 1656.24 low. While above 1431.30 low, expect dips in 3, 7, or 11 swings to find support for further upside. However, TSLA still needs to break above July 13 high to confirm that the next leg higher in wave (5) is already in progress.
The alternate count if TSLA fails to break above July 13 high is that wave (4) is not completed yet. The stock could have finished wave A of (4) as shown in the chart and currently wave B unfolded as an expanded flat structure, which ended at the last high. Afterwards, the stock could extend lower in wave C before ending wave (4) pullback and resume higher again.
TSLA 30 Minutes Elliott Wave Chart