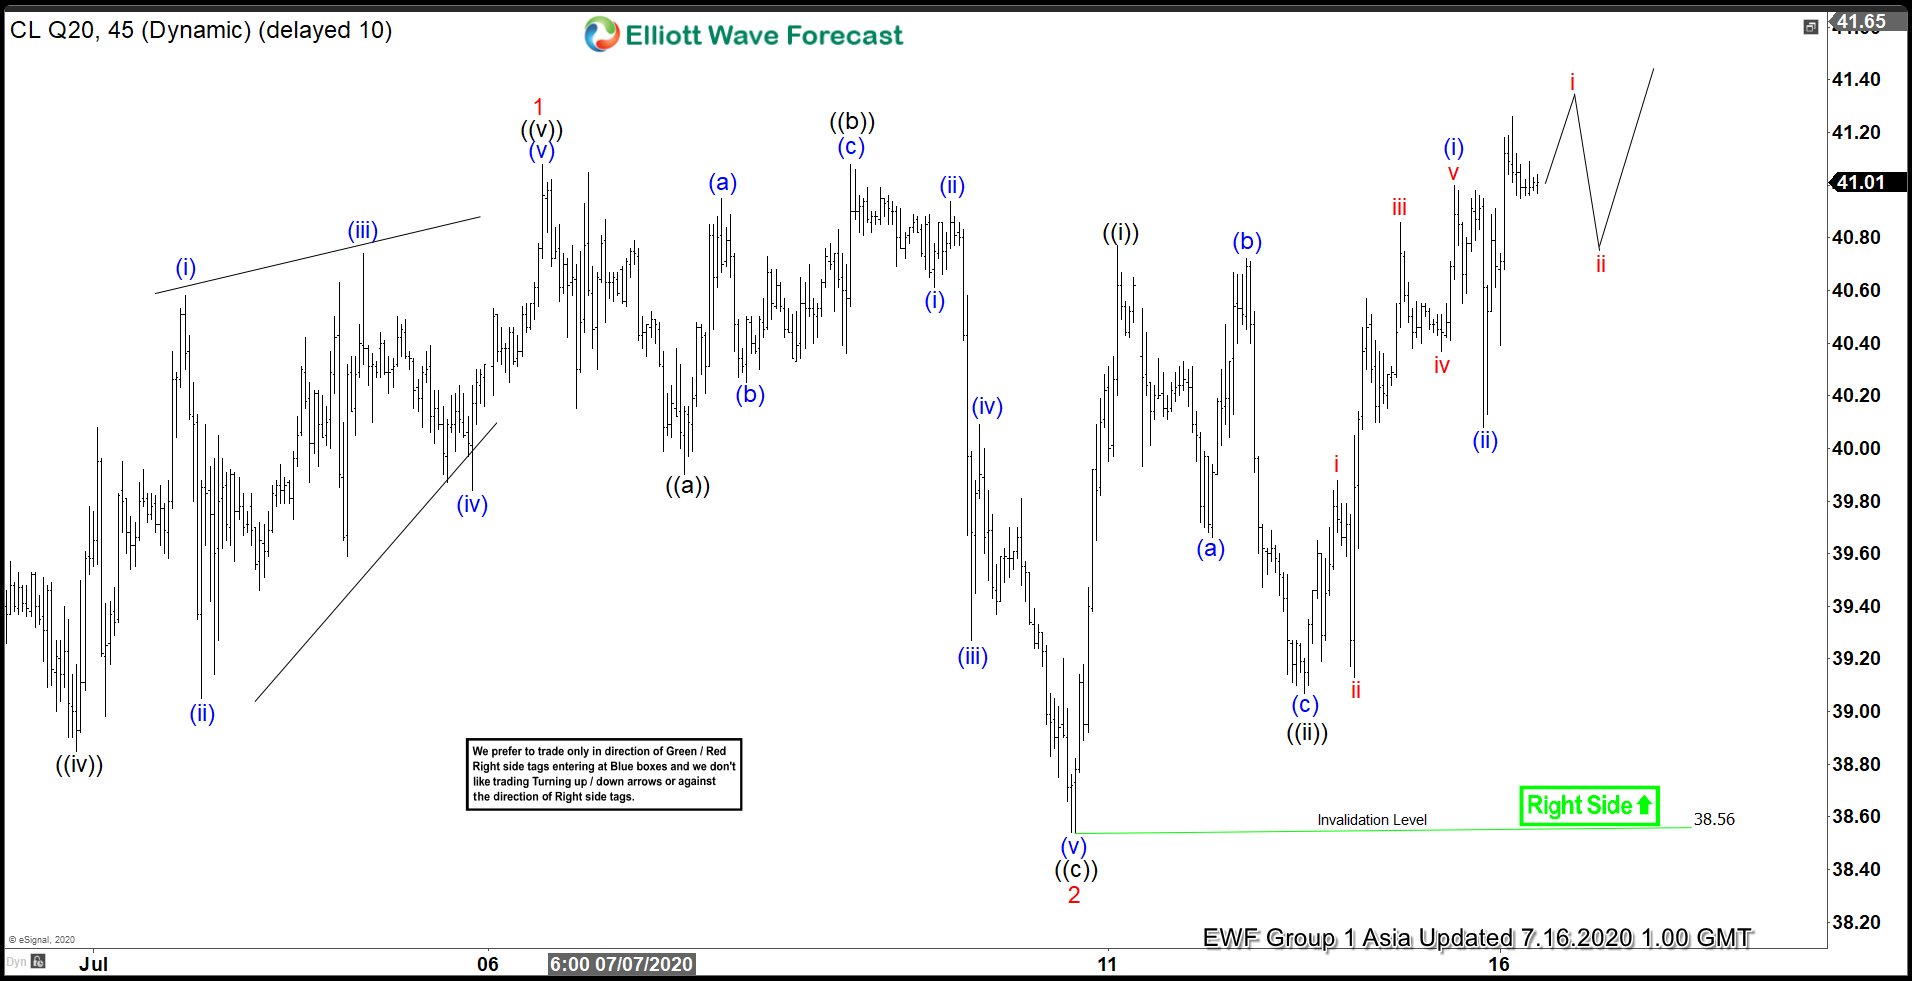
Light Crude Oil 45 minutes chart below shows that the commodity has ended cycle from July 6 high as wave 2 at 38.56 low. The pullback unfolded as a flat Elliott Wave Structure. From July 6 high, wave ((a)) ended at 39.90 low. The bounce in wave ((b)) ended at 41.08 high. Afterwards, oil declined lower in wave ((c)), which ended at 38.56 low. This ended 3 waves pullback in larger degree wave 2. From there, the commodity extended higher and broke above previous July 6 high. This confirms that wave 2 is already in place and the next leg higher is already in progress.
Up from wave 2 low, wave ((i)) ended at 40.77 high. The pullback in wave ((ii)) ended at 39.07 low. The commodity then continued to resume higher in wave (i) of ((iii)). The subdivision of wave (i) unfolded as a 5 waves impulsive Elliott Wave Structure. Up from wave ((ii)) low, wave i ended at 39.88 high and wave ii dip ended at 39.13 low. Wave iii then ended at 40.86 high and wave iv pullback ended at 40.37 low. The commodity then ended the push higher in wave v at 40.77 high. Afterwards, 3 waves pullback in wave (ii) ended at 40.08 low. While above 38.56 low, expect dips to find support in 3, 7, or 11 swings. If oil manages to break above June 23 high (41.63), it will show bullish sequence from June 15 low. The upside target would be 100% – 123.6% extension at 44.20-45.90.
Oil (CL_F) 45 Minutes Elliott Wave Chart