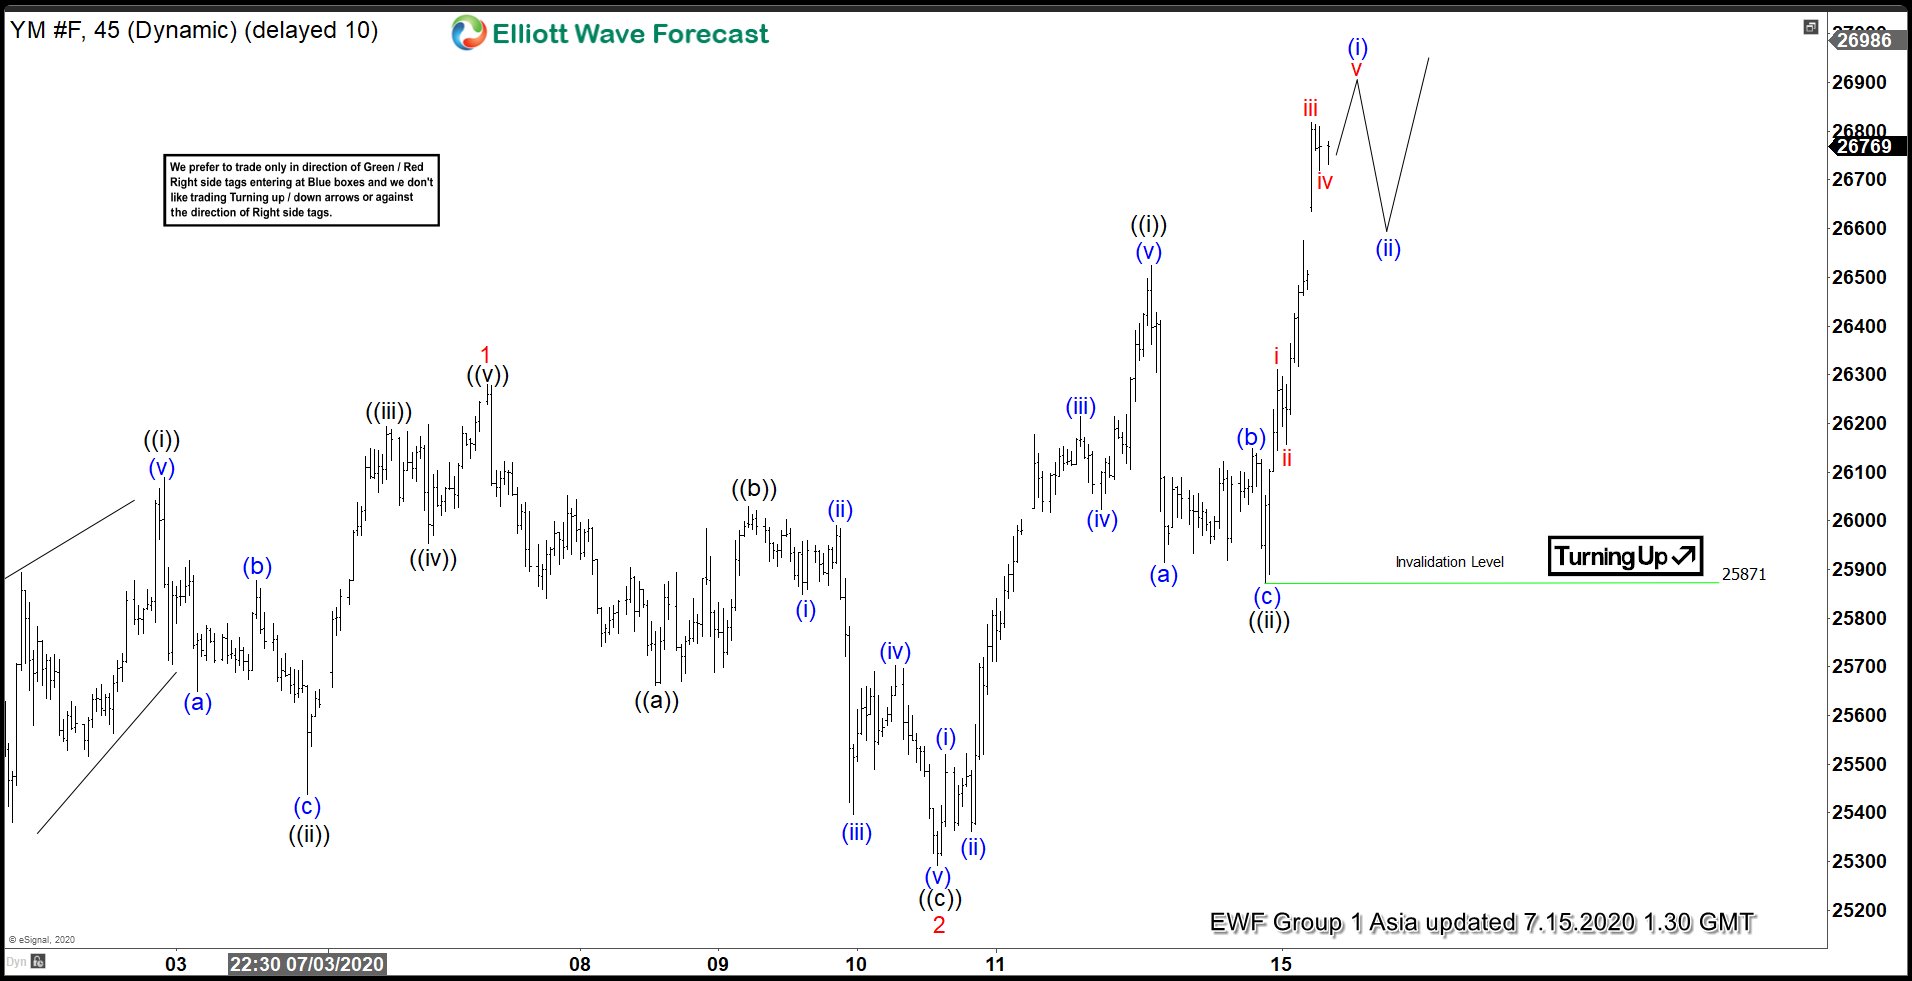
YM_F 45 minutes chart below shows that Index has ended the cycle from July 7 high as wave 2 at 25293 low. The pullback unfolded as a zig-zag Elliott Wave Structure. From July 7 high, wave ((a)) ended at 25661 low. Wave ((b)) bounce ended at 26029 high and wave ((c)) ended at 25293 low. Up from that wave 2 low, Index has resumed higher as a 5 waves Impulse Elliott Wave structure. Wave (i) ended at 25519 high and pullback in wave (ii) ended at 25362 low. Index then extended higher in wave (iii), which ended at 26215 high. Wave ((iv)) dips then ended at 26024 low. The index then pushed higher in wave (v) which ended at 26524 high. The rally ended larger degree wave ((i)) and also broke above previous wave 1 high. This confirms that the next leg higher is already in progress.
Afterwards, the Index corrected that rally as another zig-zag correction in wave ((ii)) and ended at 25871 low. From there, Index continued to resume higher in wave (i) of ((iii)), with the internal subdivision unfolding as another 5 waves Impulse in lesser degree. Up wave ((ii)) low, wave i ended at 26310 high and wave ii dip ended at 26156 low. Wave iii then ended at 26817 high and wave iv pullback ended at 26720 low. The index can still make another high in wave v, which will end wave (i) in the larger degree. A 3 waves pullback in wave (ii) should happen before the Index resumes higher. As long as pullback stays above 25871 low, expect wave (ii) dips to find support in 3, 7, or 11 swing for more upside.
YM_F 45 Minutes Elliott Wave Chart