$SMH Semiconductors Long Term Cycles & Elliott Wave
Firstly as seen on the monthly chart shown below. There is data back to May 2000 in the ETF fund. Data suggests the fund made a low in November 2008. This low has not been taken out in price. The cycles in this instrument tends to reflect the Nasdaq index fairly well however it has a larger degree difference in that the Nasdaq made a low to correct the cycle from the all time lows in October 2002 compared to the all time low made in November 2008 in the SMH semiconductors.
Secondly every way I count this data it suggests several things. Several counts are always possible the wave (III) in blue is still in progress as per the best reading of the cycles.
The analysis continues below the monthly chart.
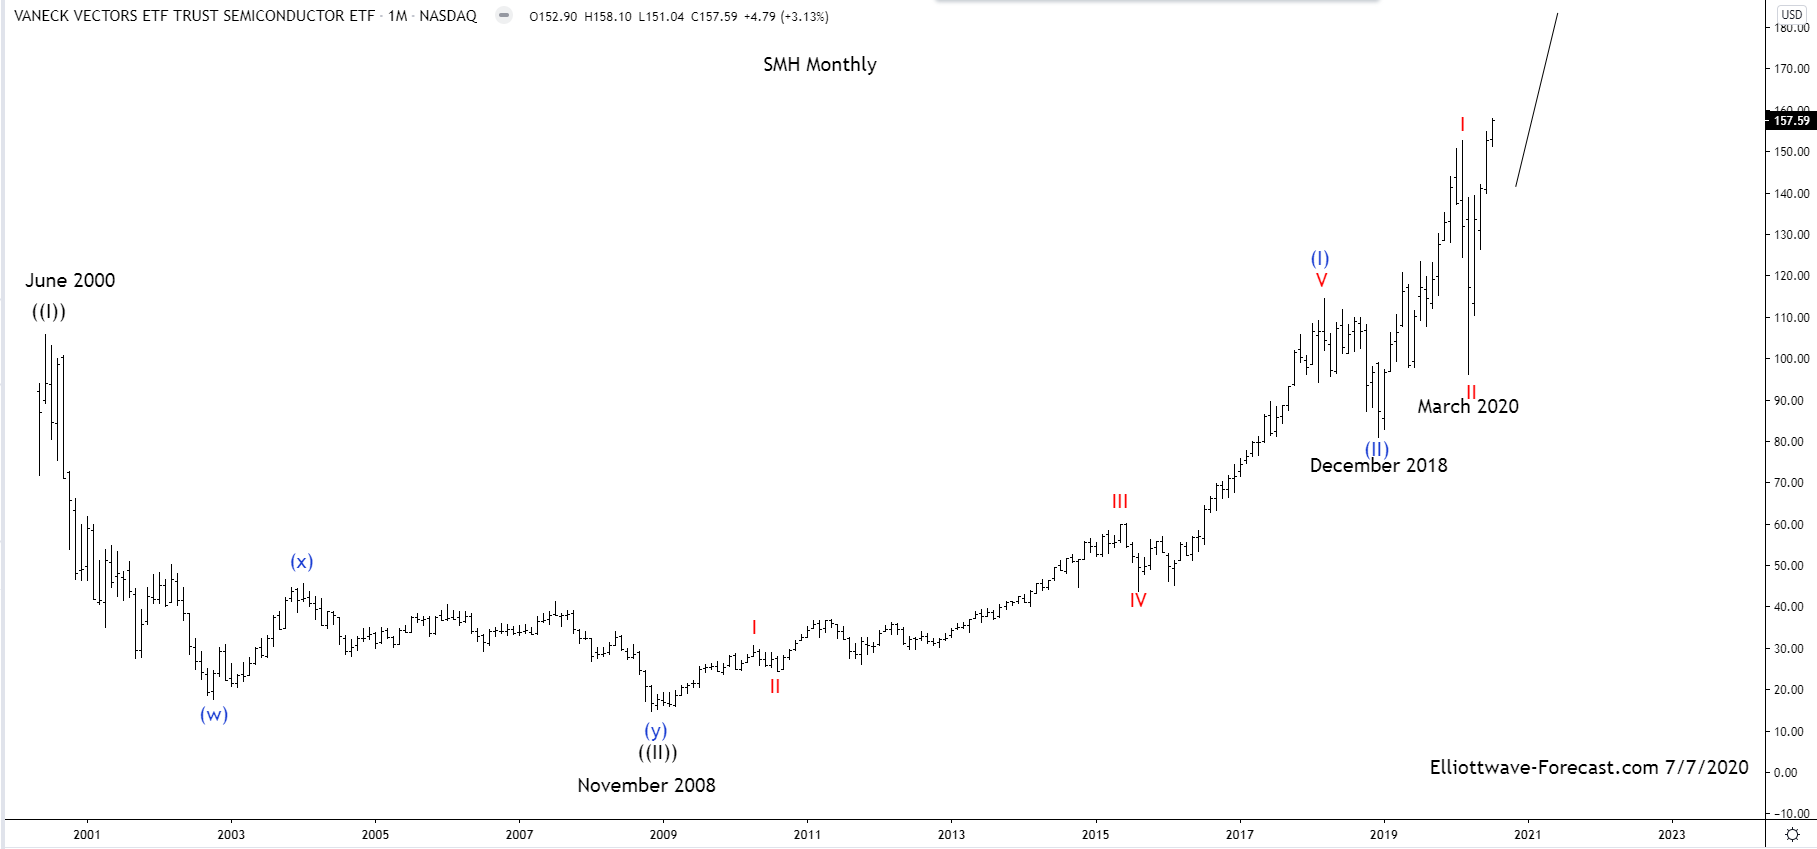
Thirdly and in conclusion. Furthermore the instrument could be called lower correcting the cycle from the 2018 lows in a 3-3-5 expanded Elliott Wave flat. The other call lower is to correct the cycle from the March 2020 lows which data does not support in the smaller time frames. The bullish direction is higher in wave (III). It appears the pullback to the March 2020 lows already corrected that cycle up from the blue wave (II) lows. I always like to give the trend benefit of the doubt. In this case it should be obvious the trend is higher. The longer term lows highlighted on the chart above suggest the SMH should trade higher while above the March 2020 lows and certainly while above the December 2018 lows according to the price data currently available.