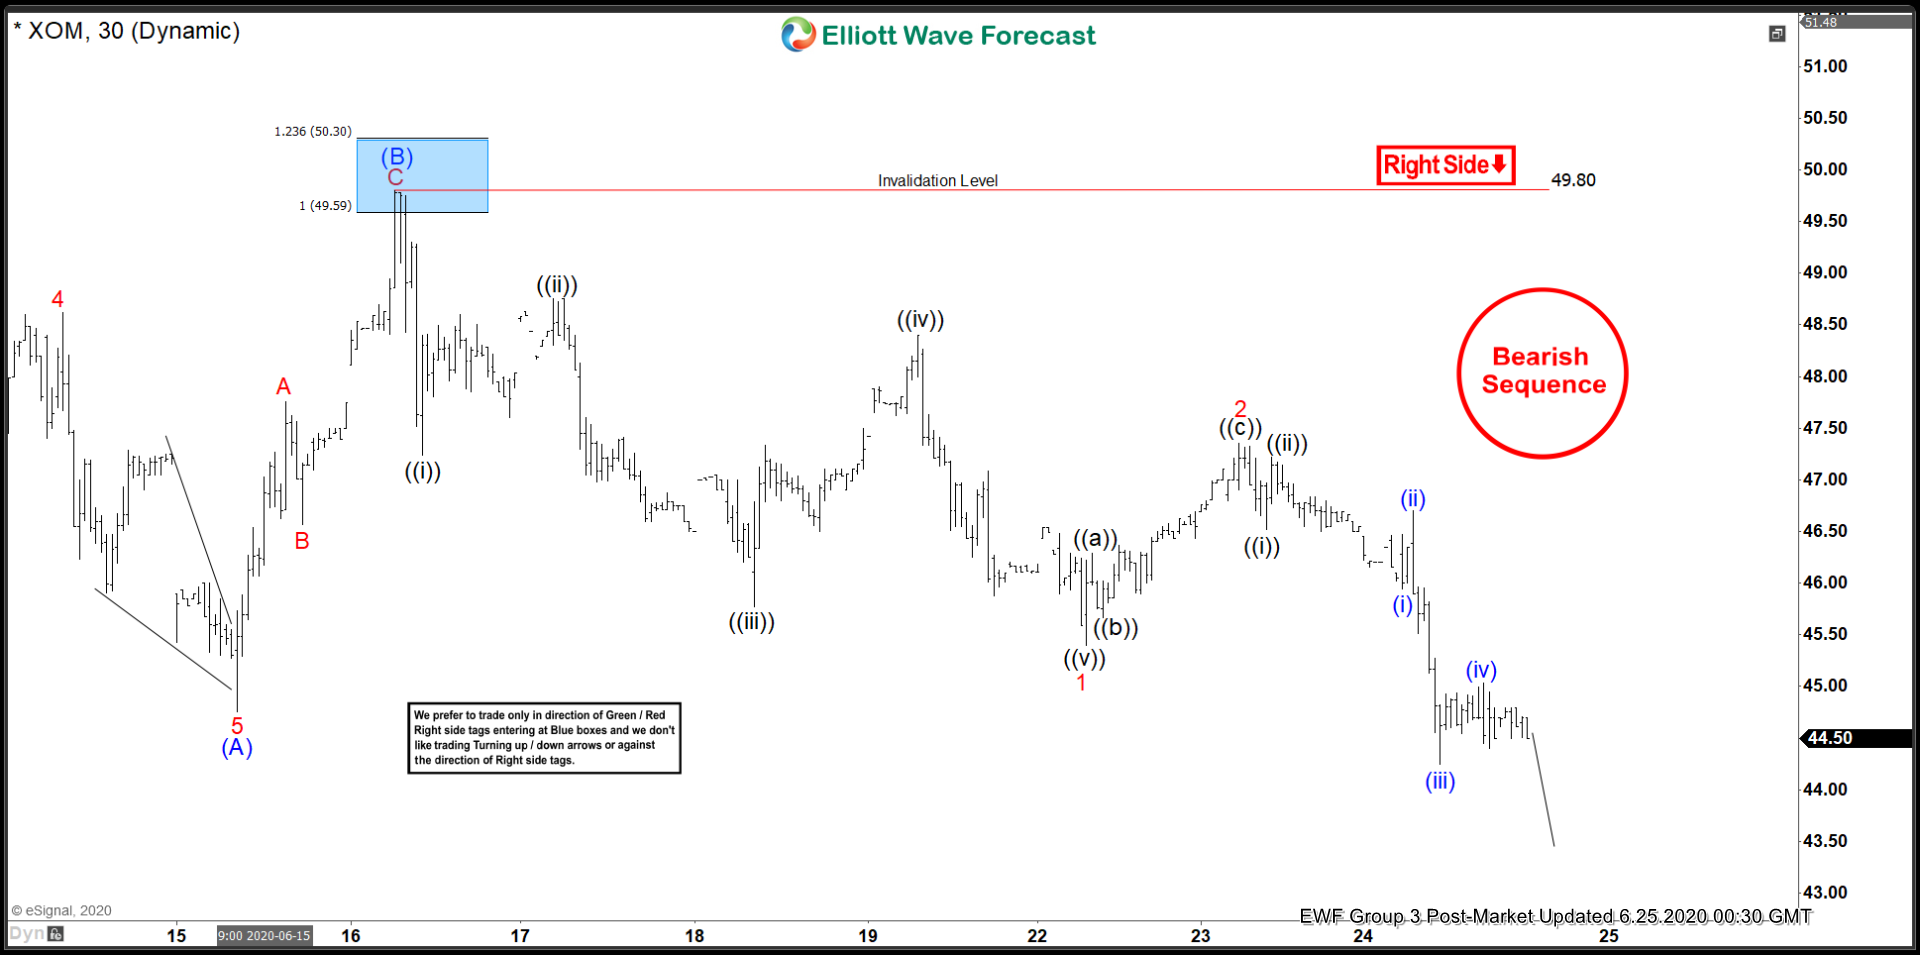
Elliott Wave View in Exxon (ticker: XOM) shows that the stock has an incomplete bearish sequence against June 8 high. The decline from June 8 high unfolded as a zigzag Elliott Wave structure, where wave (A) ended at 44.75 low. Afterwards, the bounce in wave (B) ended at 49.8 as a zig-zag Elliott Wave Structure in lesser degree. The bounce reached the 100% extension in 3 swing at the blue box area. Up from wave (A) low, wave A ended at 47.76 high and wave B pullback ended at 47.14 low. The stock then extended higher in wave C, which ended at 49.80 high. Exxon then turned lower from the blue box area. The decline has broken below wave (A) low, confirming next leg lower in wave (C) is already in progress.
Down from wave (B) high, wave 1 ended at 45.40 low. The internal subdivision of wave 1 unfolded as 5 waves impulse. Wave ((i)) ended at 47.24 low and bounce in wave ((ii)) ended at 48.75 high. The stock then resumed lower in wave ((iii)) towards 45.77 low and wave ((iv)) bounce ended at 48.20 high. Final leg wave ((v)) ended at 45.98 low, which completed wave 1. Pair then bounced in wave 2 and ended at 47.35 high. Currently, wave 3 is in progress, where wave ((i)) ended at 46.65 low and wave ((ii)) bounce ended at 47.22 high. Wave ((iii)) has resumed lower and near term, while below 49.80 high, expect bounce in 3,7, or 11 swing to fail and Exxon to extend lower again.
Exxon (XOM) 30 Minutes Elliott Wave Chart