Wirecard AG is a german provider of financial services and payment processes. Founded in 1999 and headquartered in Aschheim (Munich), Germany, the company is since 2018 a part of the DAX30 index. After a respectable rally towards 199.4 in September 2018, the shares plunged few months later in February 2019 towards 85.6. Some still believe, this has to do something with “falsification of accounts” and “money laundering” activities of the company. Later on, different controversies were spreading around. Fundamental analysts are doing incedible efforts to explain every stock price movement connecting the ups and downs with one or another fact they may find. As a matter of fact, the stock has finished the super cycle in 2018. From there, the Wirecard stock price is doing a correction lower. Once the consolidation is ended, investors will obtain a once-in-a-lifetime opportunity to enter the market.
Wirecard Weekly Elliott Wave Analysis 06.16.2020
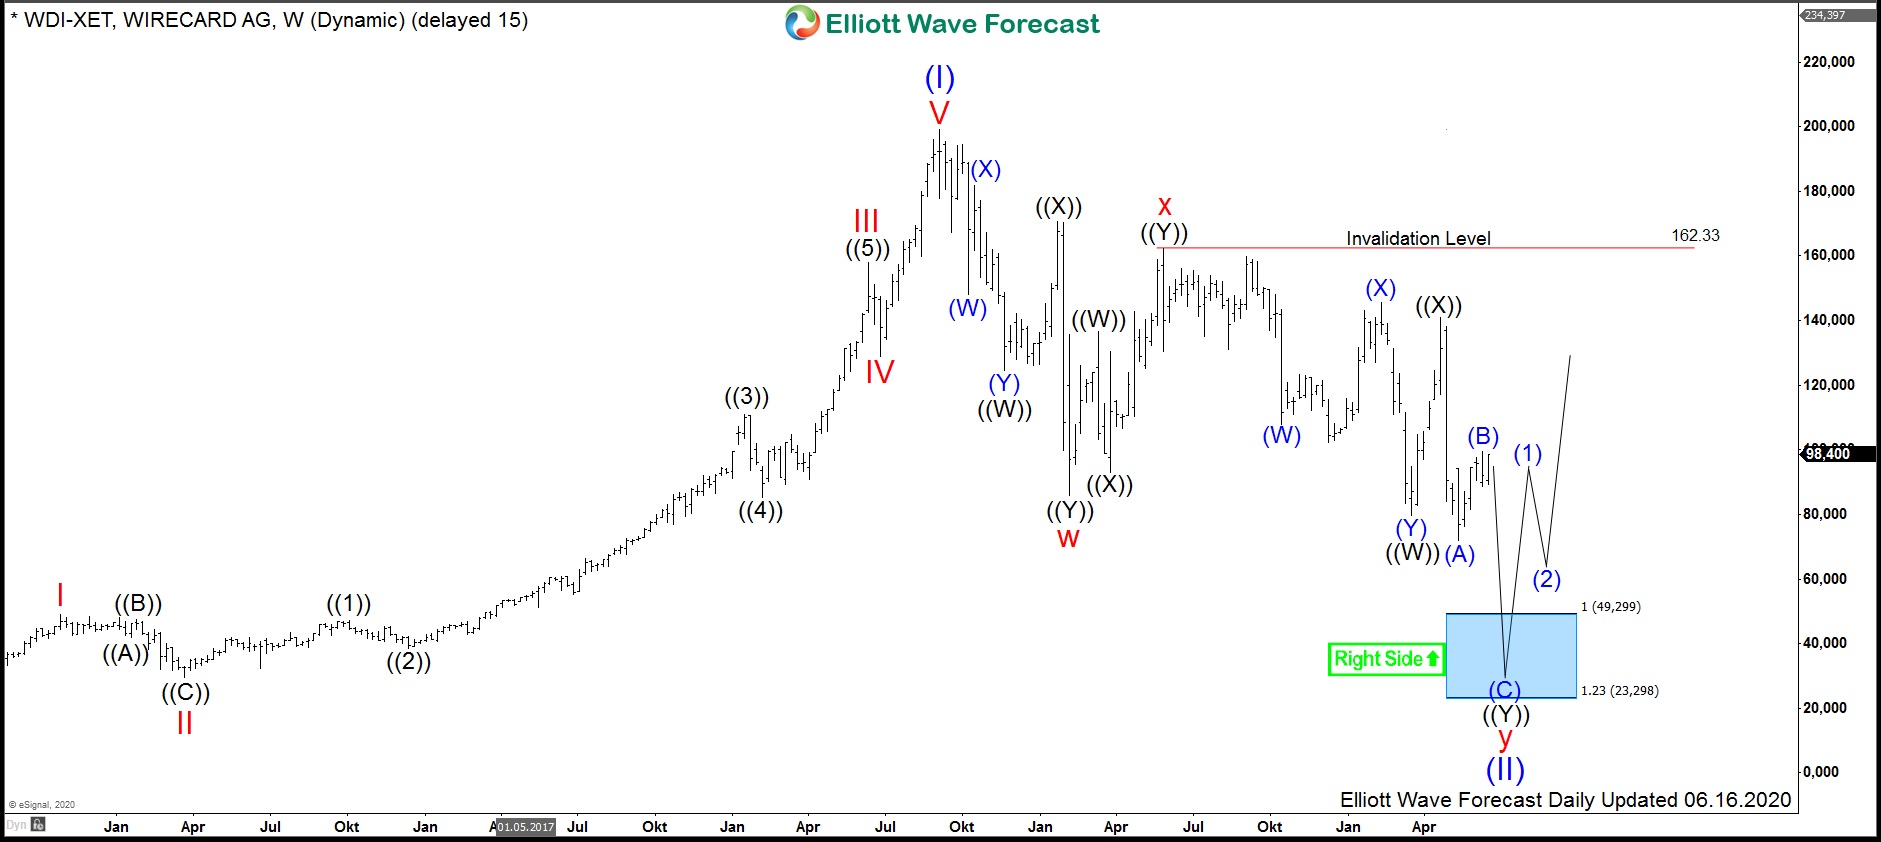
The weekly chart below shows the Wirecard stock $WDI traded at XETRA. From the all-time lows, the stock price has demonstrated a rally in wave (I) of super cycle degree. This impulsive move up has printed a top in September 1998 at 199.4. From the peak, the wave (II) to correct the cycle higher is unfolding as an Elliott wave double three structure and it is currently in the last stages to accomplish the pattern.
Within the super cycle in wave (II), the cycle lower in 3 swings as a red wave w has found a bottom in February 2019 at 85.6. After a 3 waves pullback, from technical point of view, the rally may resume. However, in July 2019 the price trendline has been broken to the downside. So far, only 3 waves higher can be recognized. Therefore, this move higher marks a connector wave x which has ended in May 2019 at 162.3.
From May 2019 highs, the prices have broken in black wave ((W)) the February 2019 lows by printing a bottom on March 2020 at 80.6. This lower low became the 5th swing of the corrective cycle. It supports the double three correction pattern and has opened a weekly bearish sequence against 162.6 highs related to 199.4 highs. Unless truncation will happen, after a bounce in wave ((X)) another leg lower in ((Y)) should follow. Ideally, the prices should fall in red wave y to the equal legs extension towards 49.3-23.3 area.
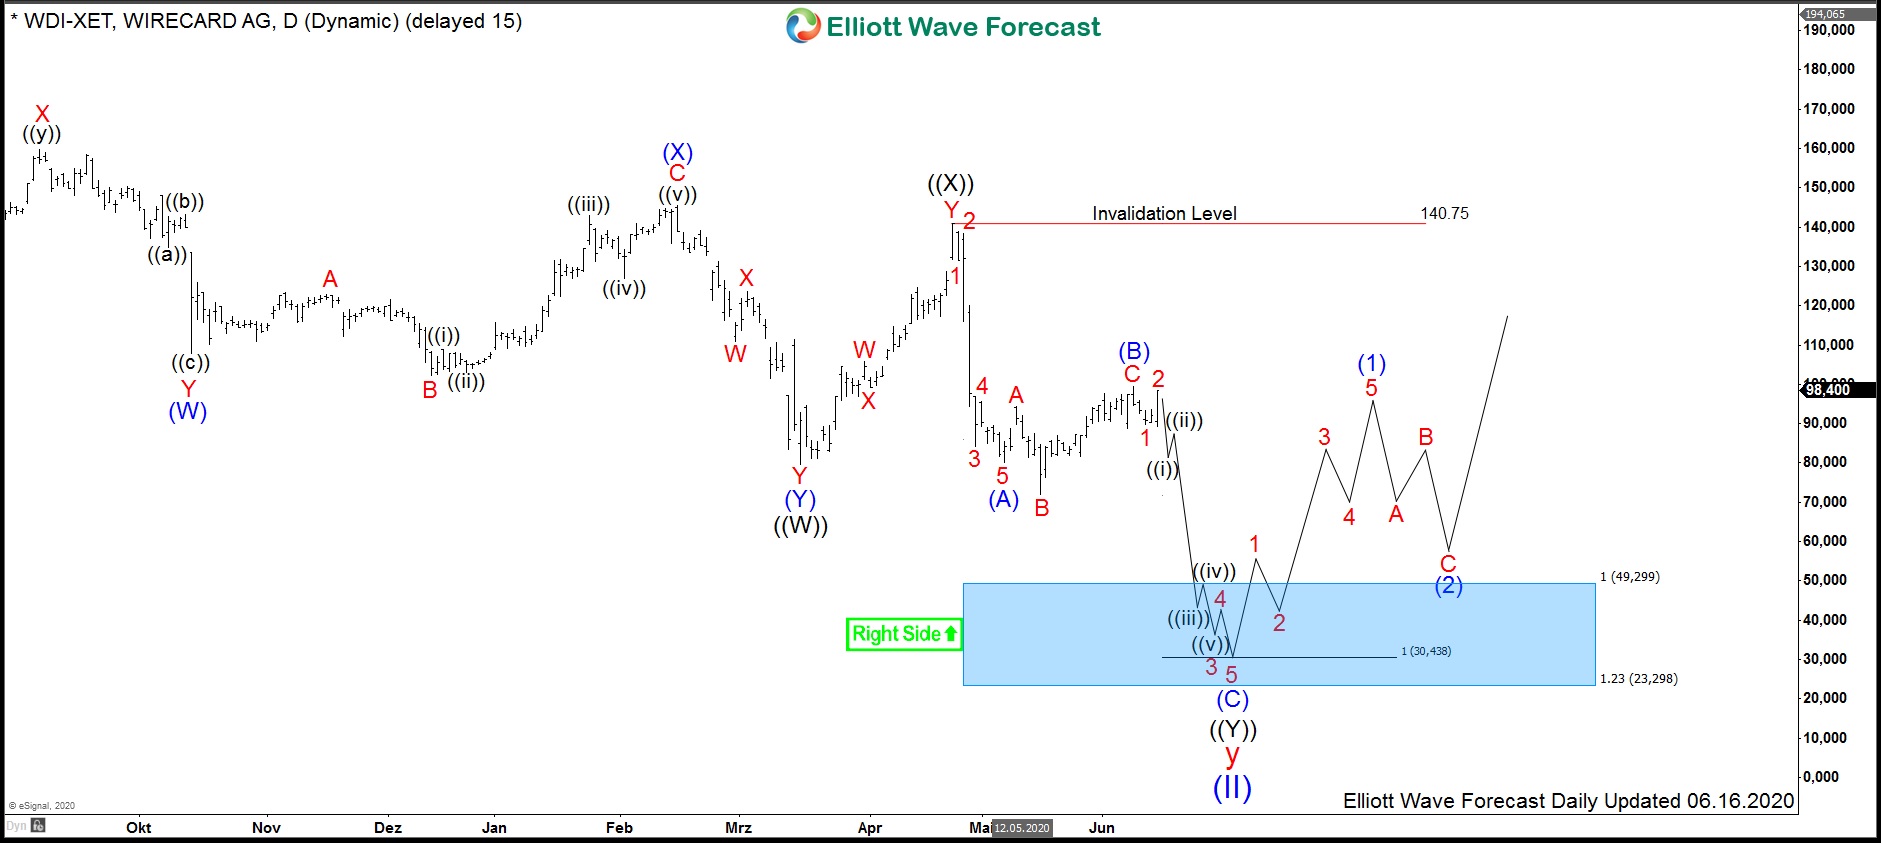
Wirecard Daily Elliott Wave Analysis 06.16.2020 and Outlook
The daily chart below shows in more detail the subdivisions of the red wave y. After 3 swings lower in black wave ((W)) and 3 swings higher in a connector wave ((X)), a first leg lower in a blue wave (A) as an impulse has broken the March 2020 lows opening a daily bearish sequence against against 140.8 highs related to 162.6 highs. After a bounce in wave (B), the Wirecard stock may fall in another 5 waves of blue wave (C) of ((Y)) towards 49.3-23.3. Hereby, it can reach deep inside the blue box towards 30.4 to mark the equality between waves (A) and (C). As a consequence, patient investors will become an opportunity to enter the market at prices within 30.4-49.3 buying area. From there, the market should resume the rally towards 199.4 and higher or for a 3 waves bounce at least.