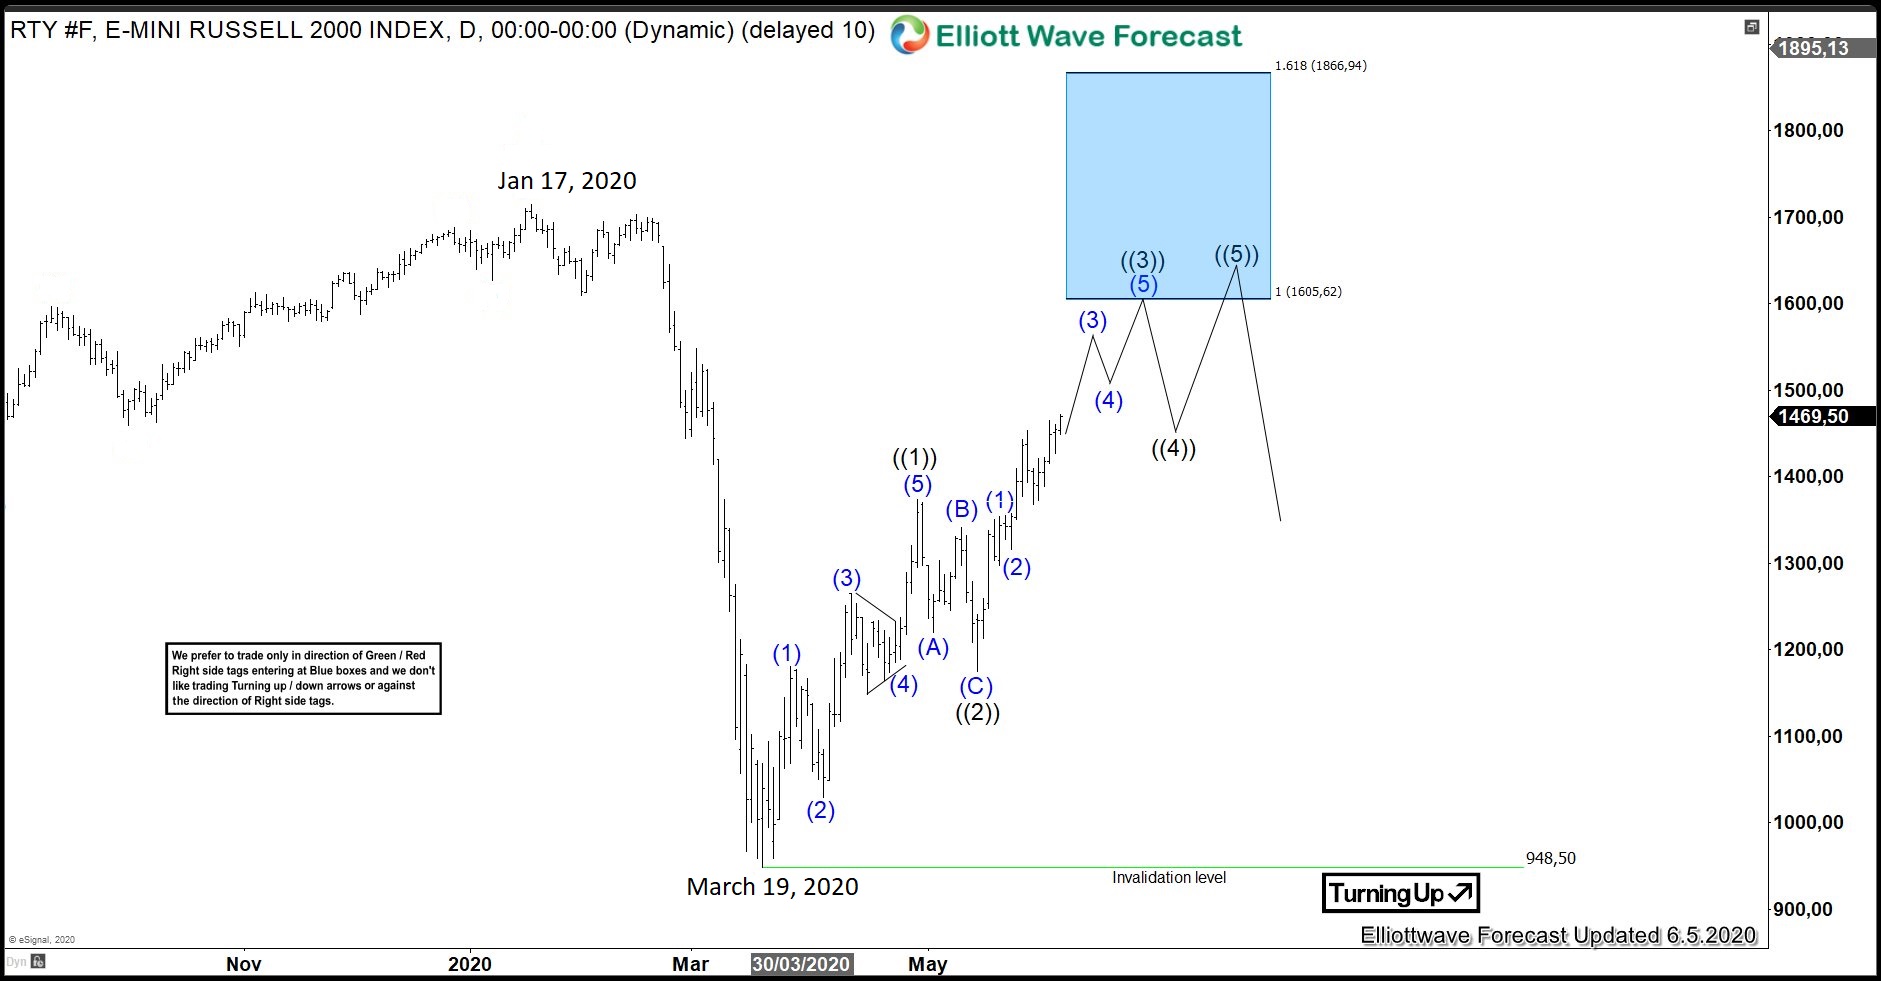
In this blog, we are going to take a look at the Elliottwave chart of RTY_F. Daily chart below shows that RTY_F ended the decline from January 17, 2020 high at 948.50 low. Since reaching that March 19 low, the index has continued to extend higher. From 948 low, the index extended higher in wave ((1)), which ended at 1374 high. This is followed by a pullback in wave ((2)), which unfolded as a zig-zag and ended at 1175 low. The index has managed to continue to extend higher from that low. Now, it shows an incomplete bullish sequence after it manages to break above the previous wave ((1)) high. The 100% -161.8% extension of wave ((1))-((2)) where next leg higher can target is between 1605-1866 area.
RTY_F Daily Elliott Wave Update
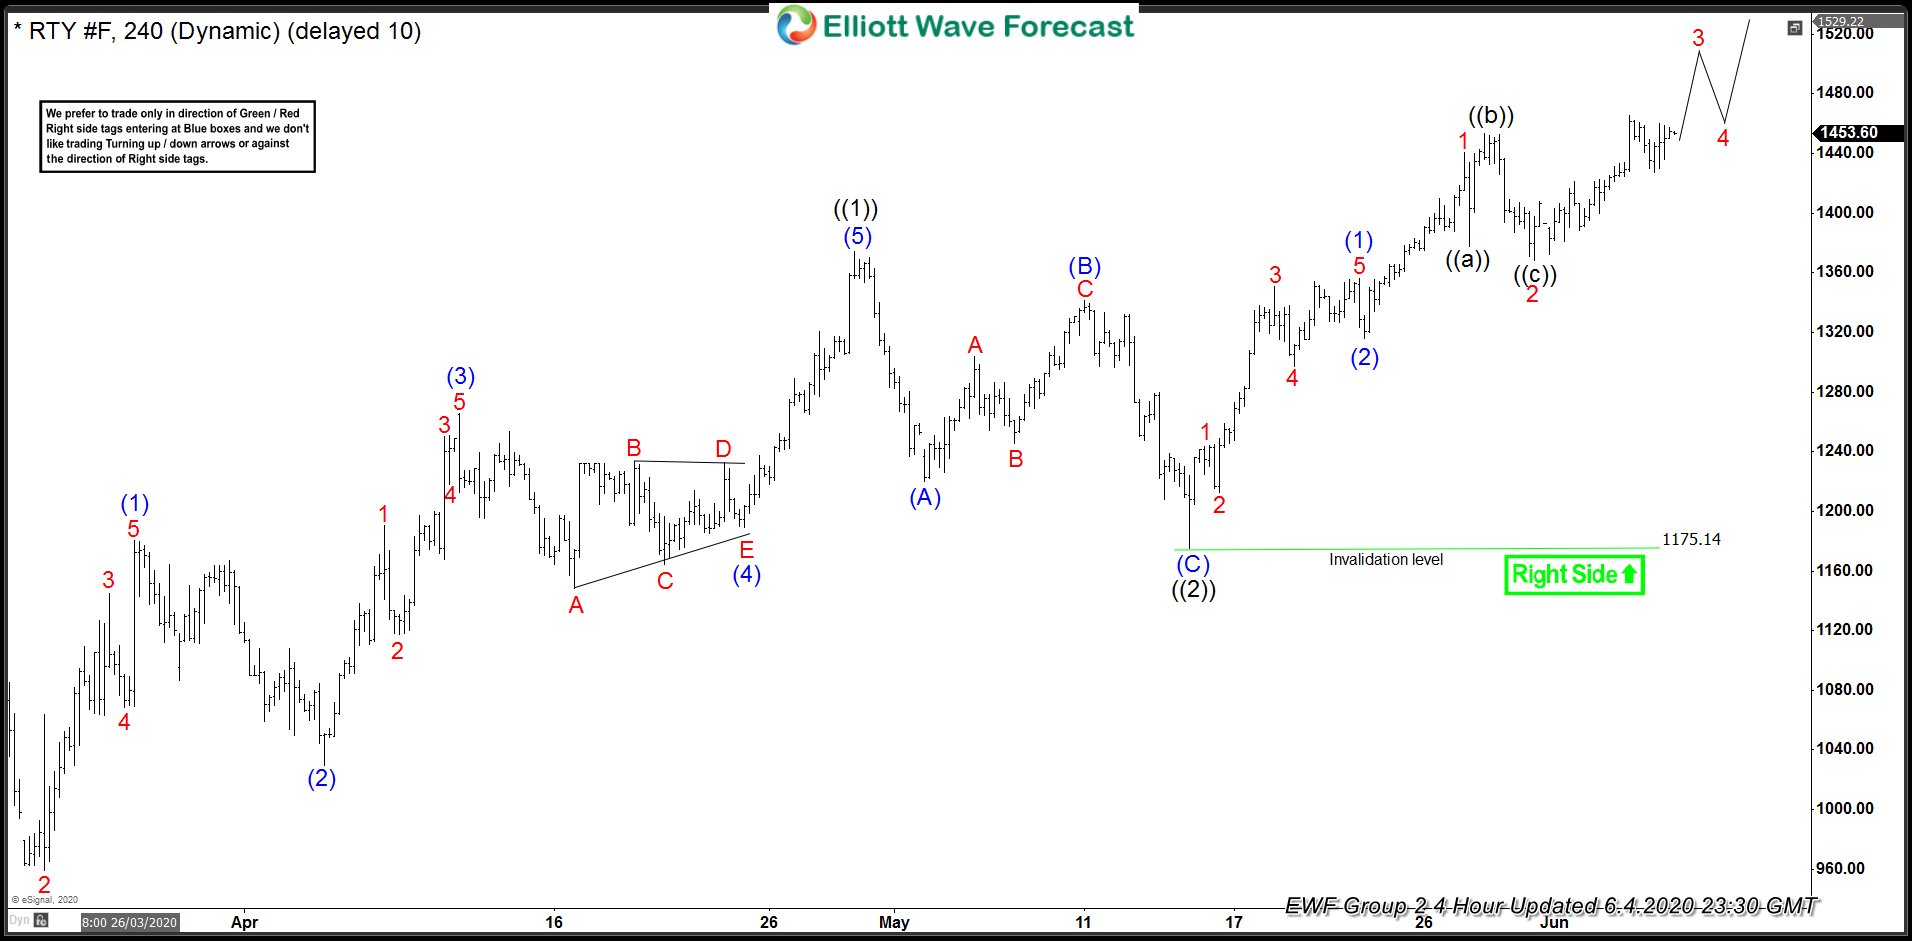
The 4 hour chart below shows that the index is currently within wave (3) of ((3)). From 1175 low, wave (1) ended at 1356 high. The pullback is wave (2) ended at 1316 low. Afterwards, the index continued to extend higher and ended wave 1 at 1440 high. The rally broke above previous wave ((1)) high to confirm that the next leg higher has started. Wave 2 pullback unfolded as a flat and ended at 1368 low. From there, RTY_F has managed to make new highs. As long as the pivot at 1175 low stays intact, expect the dips in 3,7, or 11 swings to be supported for more upside. The index then has the scope to continue higher until it reaches the equal leg blue box area in the Daily chart.
RTY_F 4 Hour 6.4.2020 Elliott Wave Update