Elliott Wave View in GBPAUD suggests the decline from 5.4.2020 high is unfolding as a 5 waves impulsive Elliott Wave structure. Down from 5.4.2020 high, wave 1 ended at 1.8943 and bounce in wave 2 ended at 1.9127. Pair then resumed lower in wave 3 towards 1.845. The 30 minutes chart below shows the move down in wave 3. Pair then bounced in wave 4 and ended at 1.881. Internal of wave 4 unfolded as a zigzag Elliott Wave structure where wave ((a)) ended at 1.8628, wave ((b)) ended at 1.8457, and wave ((c)) ended at 1.8661.
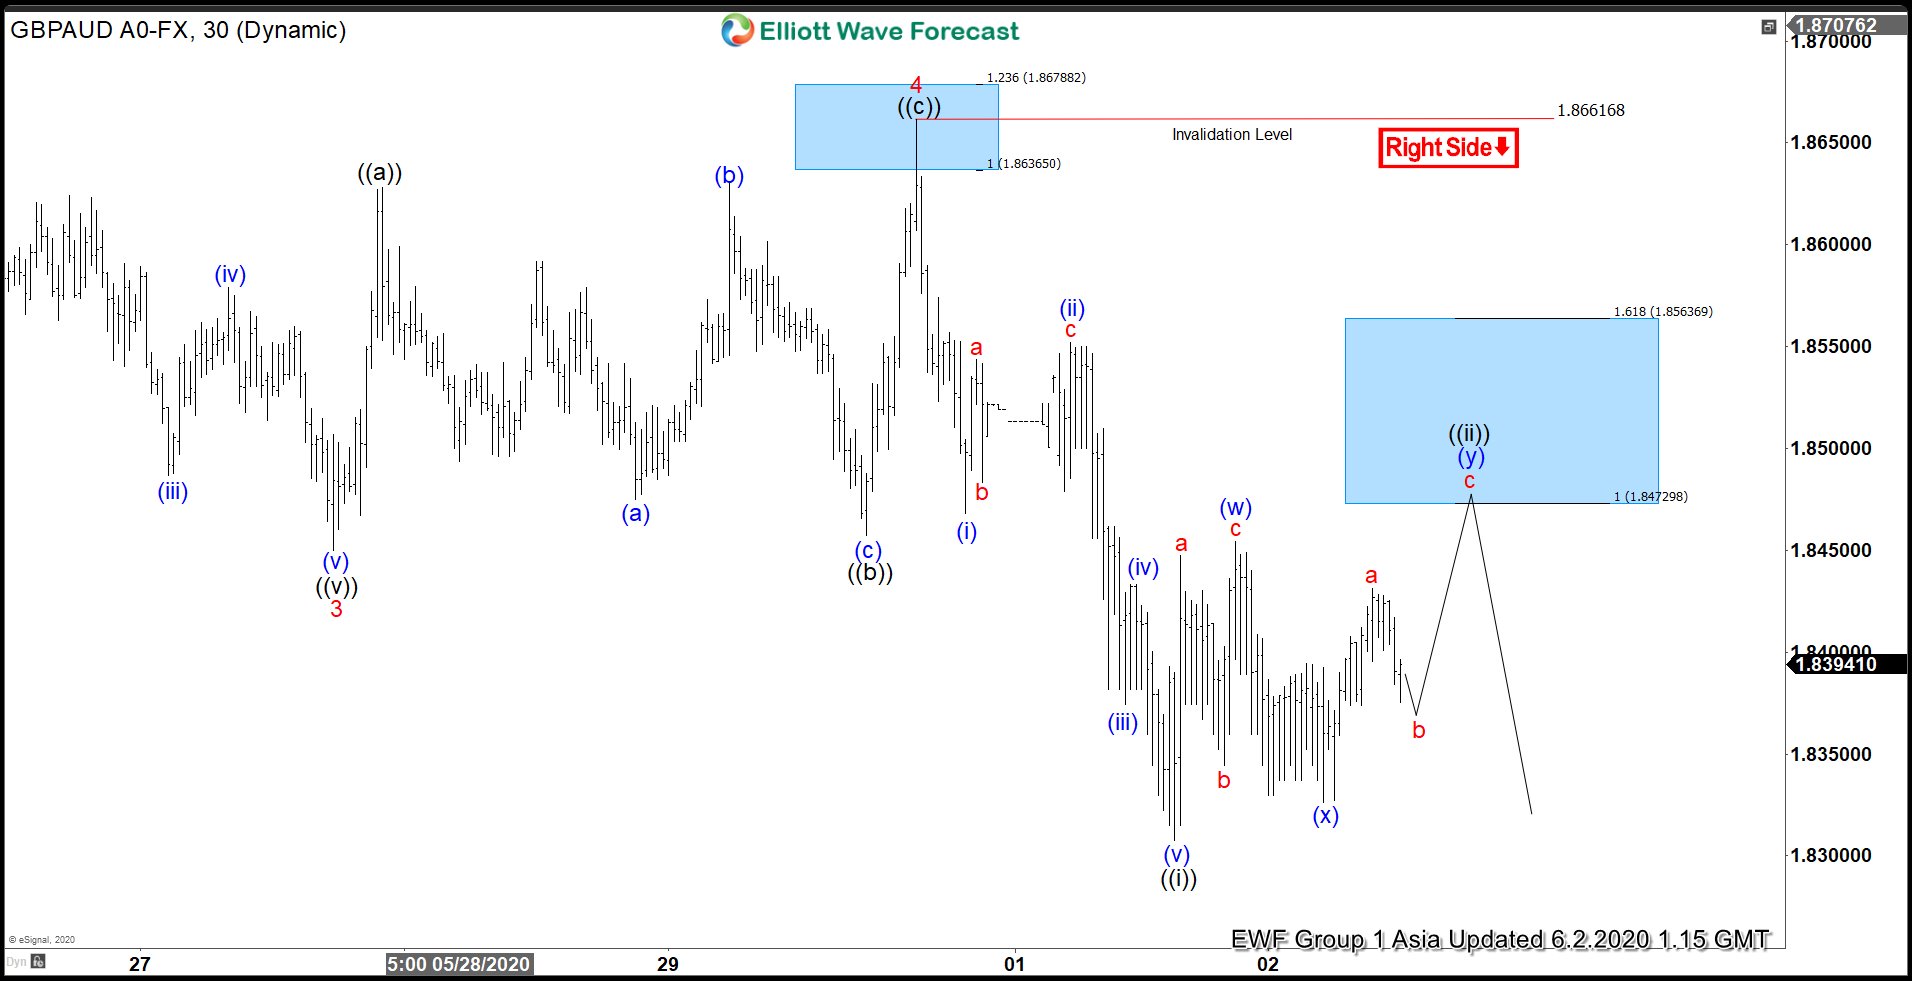
Wave 5 is in progress with internal subdivision of another impulse in lesser degree. Down from 1.8661, wave (i) ended at 1.8467 and wave (ii) bounce ended at 1.8552. Pair then resumed lower in wave (iii) towards 1.8374, wave (iv) bounce ended at 1.8433, and wave (v) ended at 1.8307. This also completed wave ((i)) in higher degree. Wave ((ii)) is currently in progress and has scope to do double zigzag towards 1.847 – 1.856 where sellers should appear. As far as pivot at 1.866 high remains intact, expect rally to fail in 3, 7, or 11 swing for more downside.
GBPAUD 30 Minutes Elliott Wave Chart