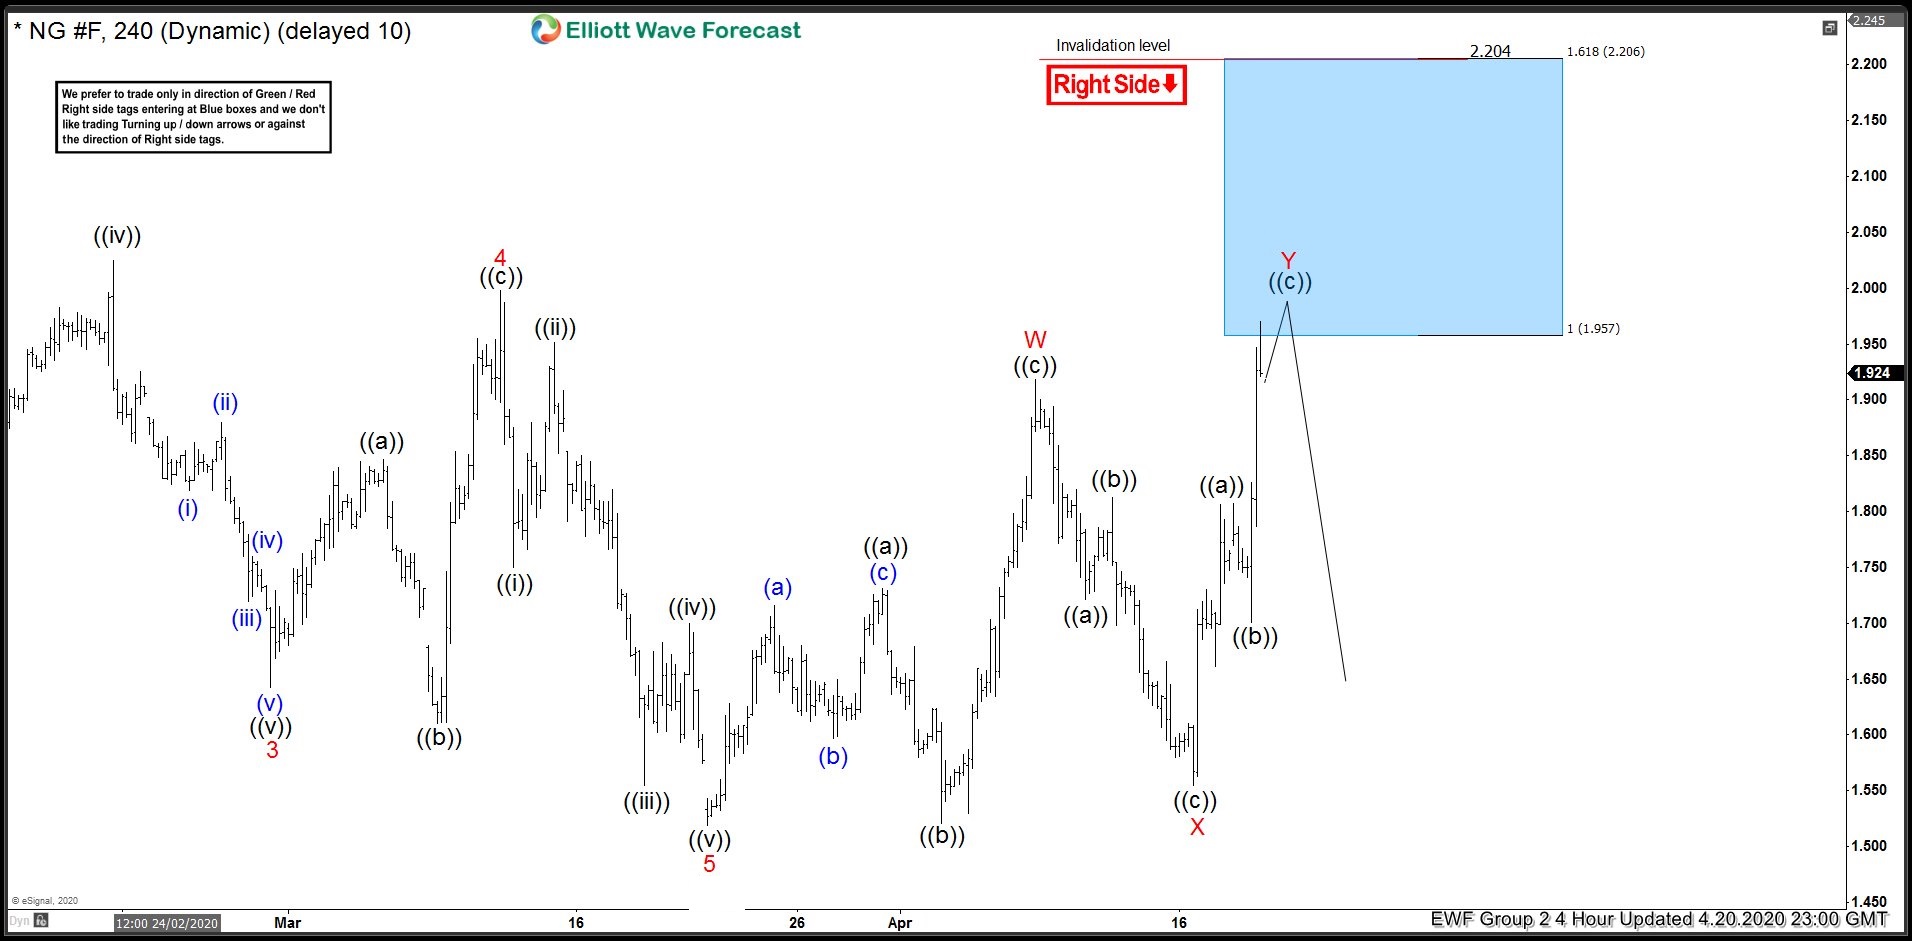
In this blog, we are going to take a look at the Elliott Wave chart of Natural Gas (NG_F). The 4 hour chart update from 20 April shows that cycle from May 11, 2019 high ended at 1.519 low. The commodity then bounced higher as a double three. Up from 1.519 low, Natural Gas ended wave W at 1.918 high. The pullback in wave X ended at 1.555 low. The pair then pushed higher in wave Y. The 100% extension of wave W-X where wave Y can potentially end is at 1.957 – 2.206 area, shown with a blue box. The blue box area is the area where we expect sellers to appear for 3 waves pullback at least.
Natural Gas (NG_F) 4.20.2020 4 Hour Elliott Wave Update
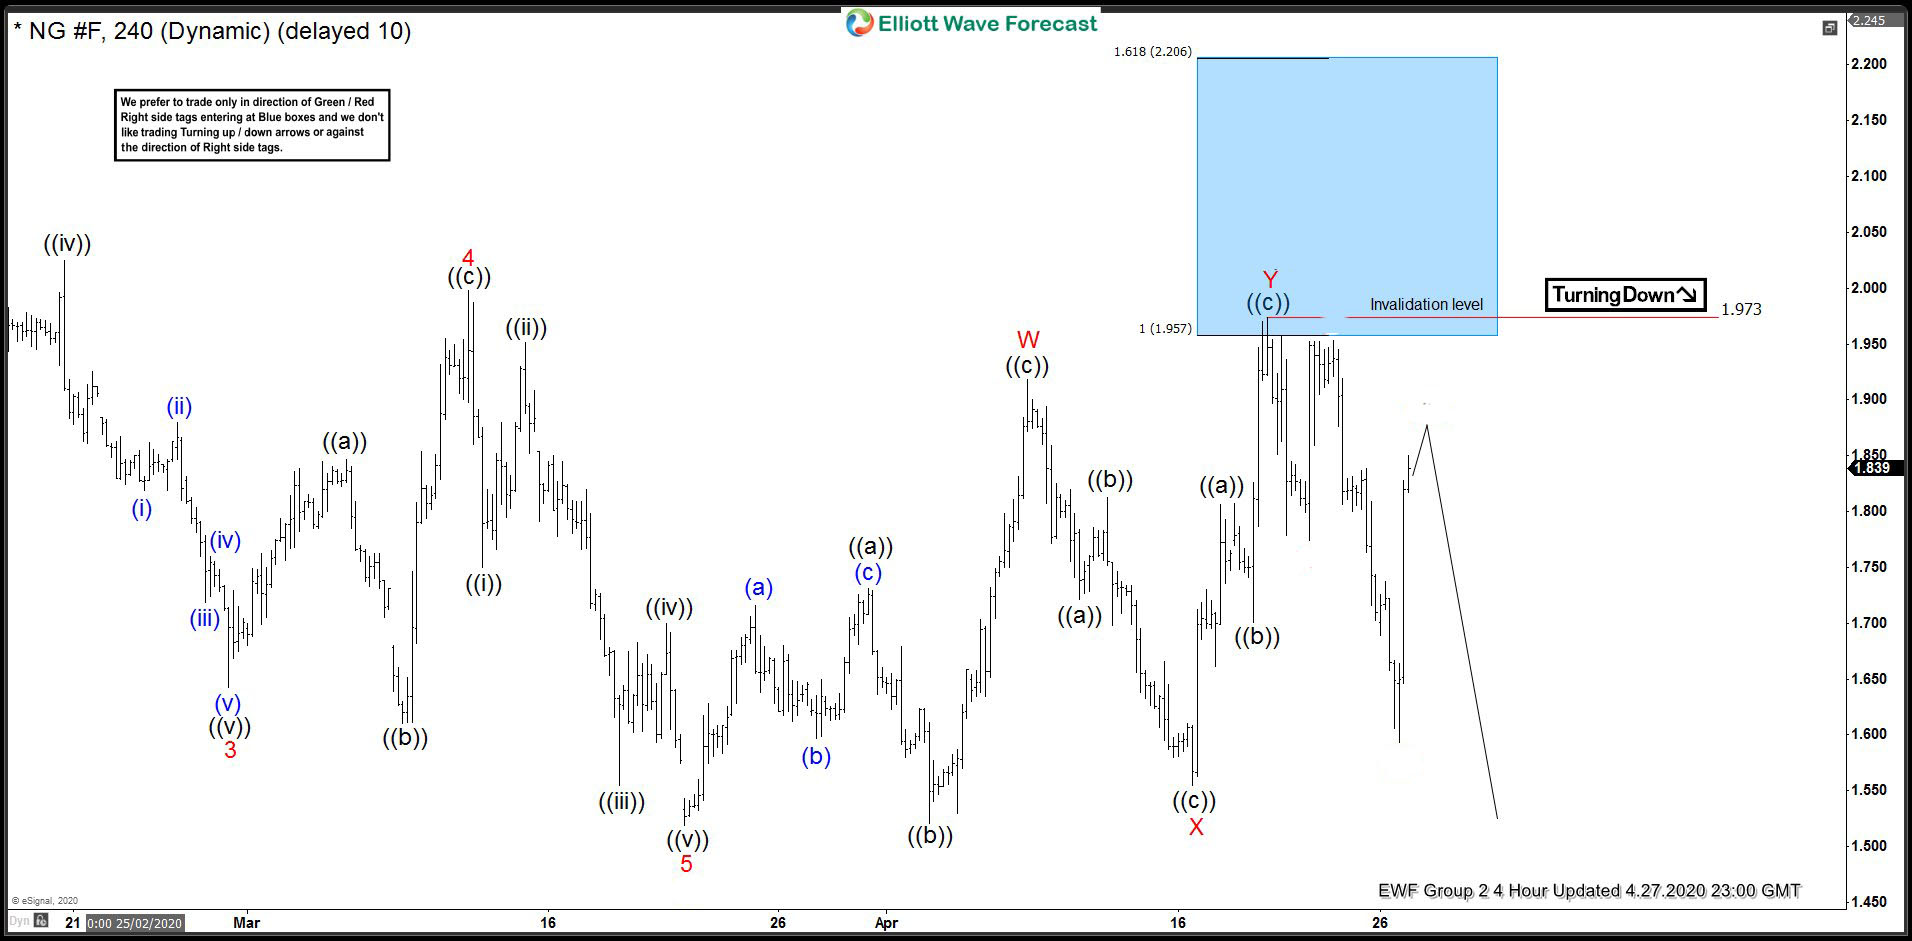
The 4 hour chart update from 27 April below shows that Natural Gas ended wave Y within blue box area at 1.973 high. From there, the commodity extended lower and made the minimum 3 waves pullback. The decline has already reached the 50% retracement of the previous leg higher. This allows sellers from the blue box a risk free position by moving stop loss to break even level. While below 1.973 high, the bounce in 3,7 or 11 swings is expected to fail. Natural Gas still needs to break below the previous low at 1.519 to confirm that the next leg lower has started and avoid further double correction.
Natural Gas (NG_F) 4.27.2020 4 Hour Elliott Wave Update
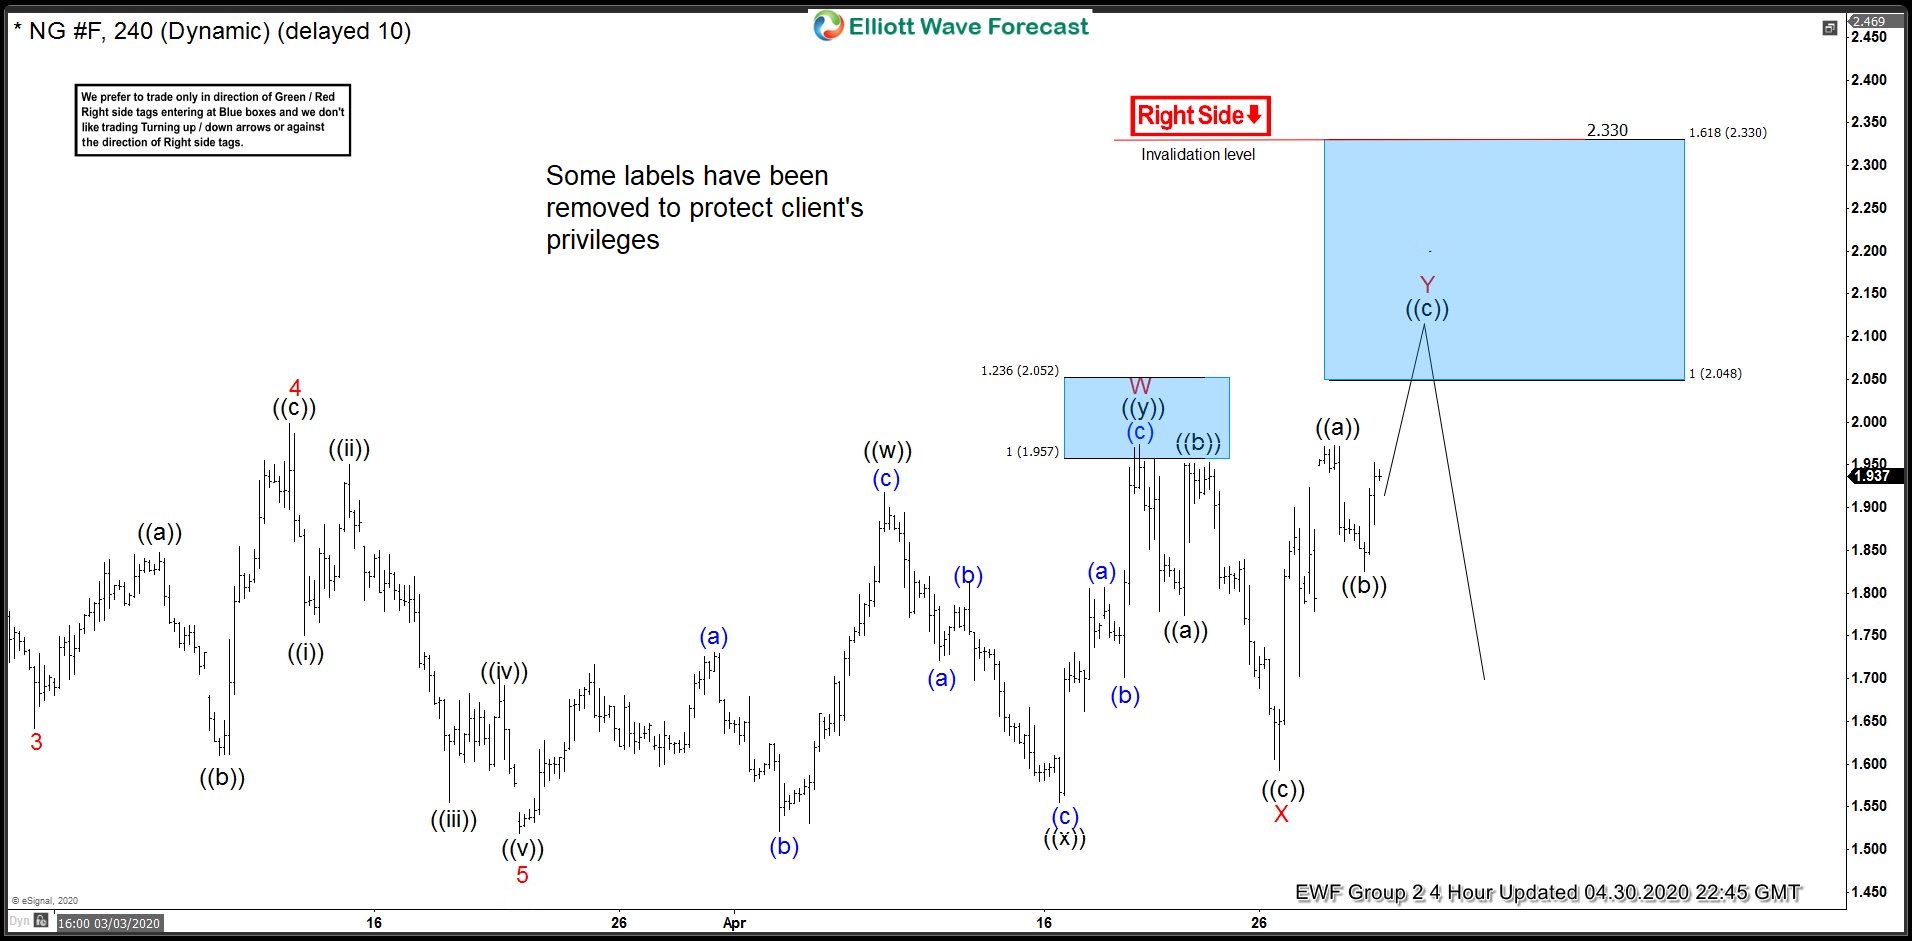
April 30 4 hour update below shows that Natural Gas failed to break below the previous low. The commodity only managed to do 3 waves pullback from the blue box. Afterwards, it continued to bounce higher and broke above the previous high at 1.973. This suggests Natural Gas is doing a double correction and the count was adjusted with the connector wave W at 1.973 high and wave X at 1.586 low. The 100% extension where wave Y can potentially end is at 2.048-2.330 area, marked with another blue box. As long as the 1.618 extension at 2.330 stays intact, the blue box should provide another reaction lower for a minimum 3 waves pullback.
Natural Gas (NG_F) 4.30.2020 4 Hour Elliott Wave Update
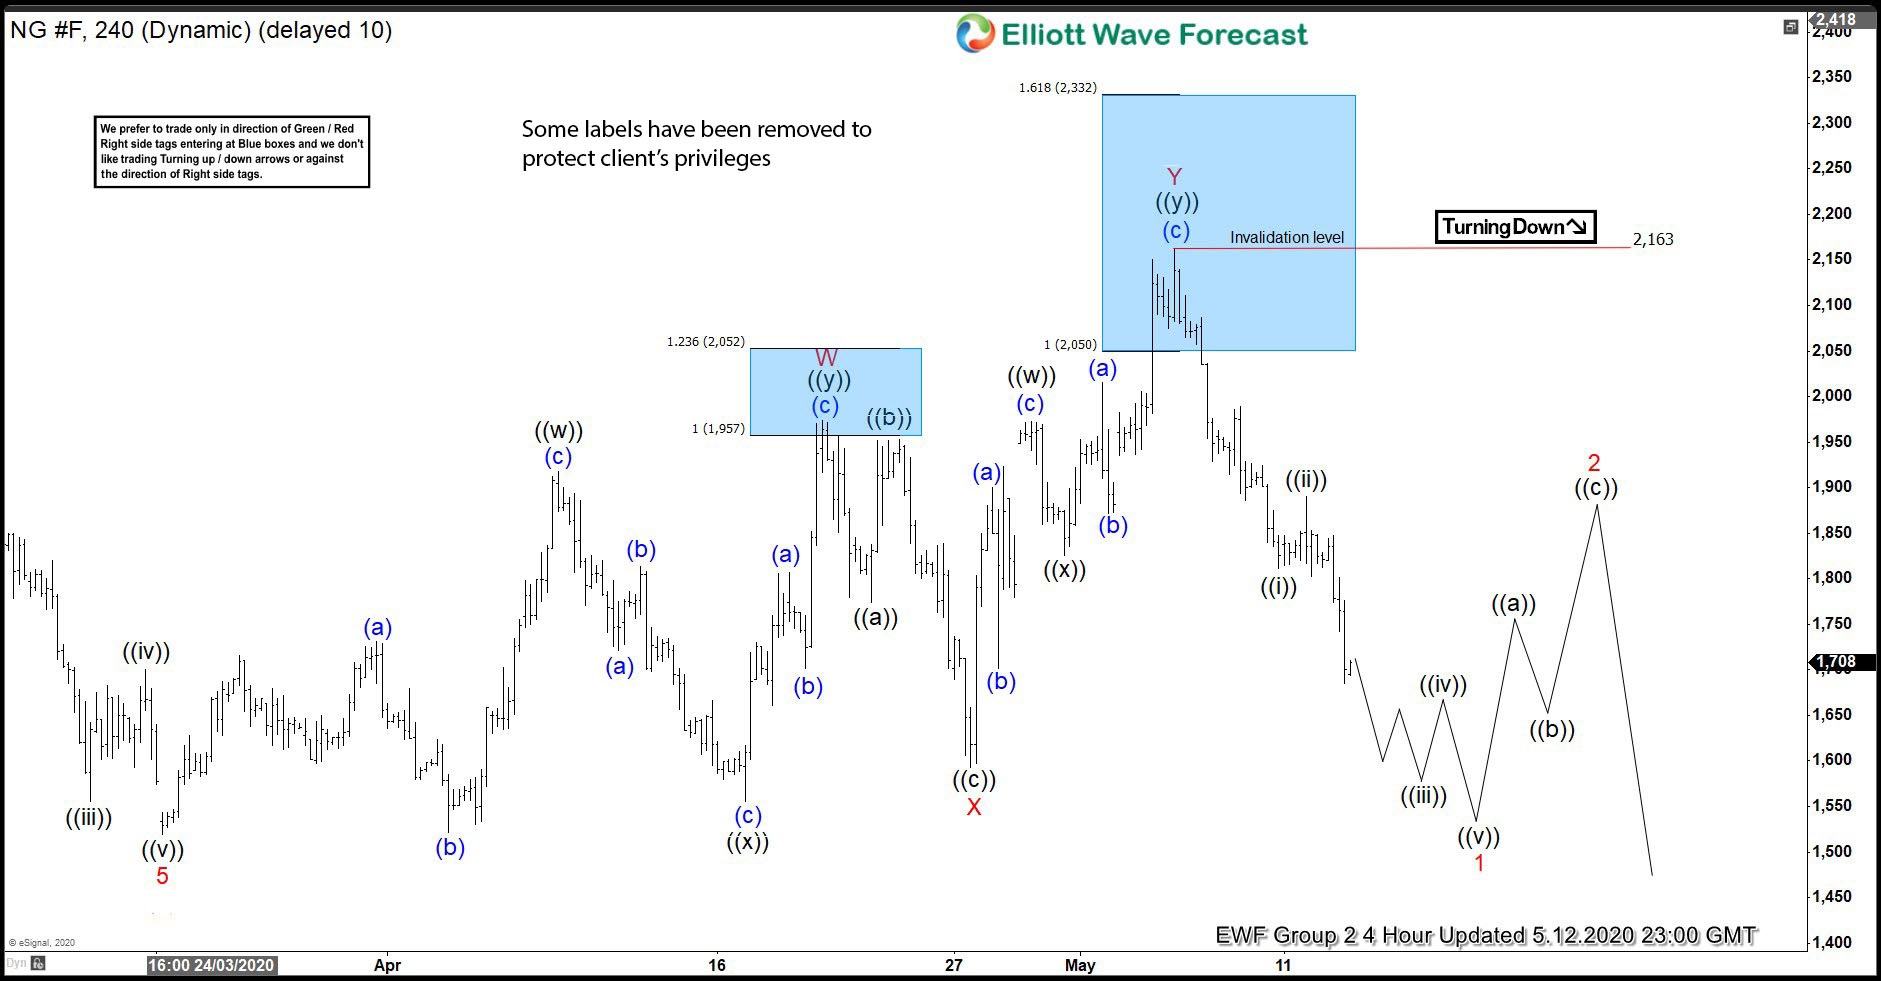
The latest 4 hour chart update from May 12 below shows that the commodity reached the second blue box area. It ended wave Y at 2.163 high and subsequently turned lower from there. The decline has already reached the 50% retracement of the rally from wave X low, again allowing sellers from the blue box another risk free position. The commodity still needs to break below the previous 1.519 low to resume the downside.
Natural Gas (NG_F) 5.12.2020 4 Hour Elliott Wave Update