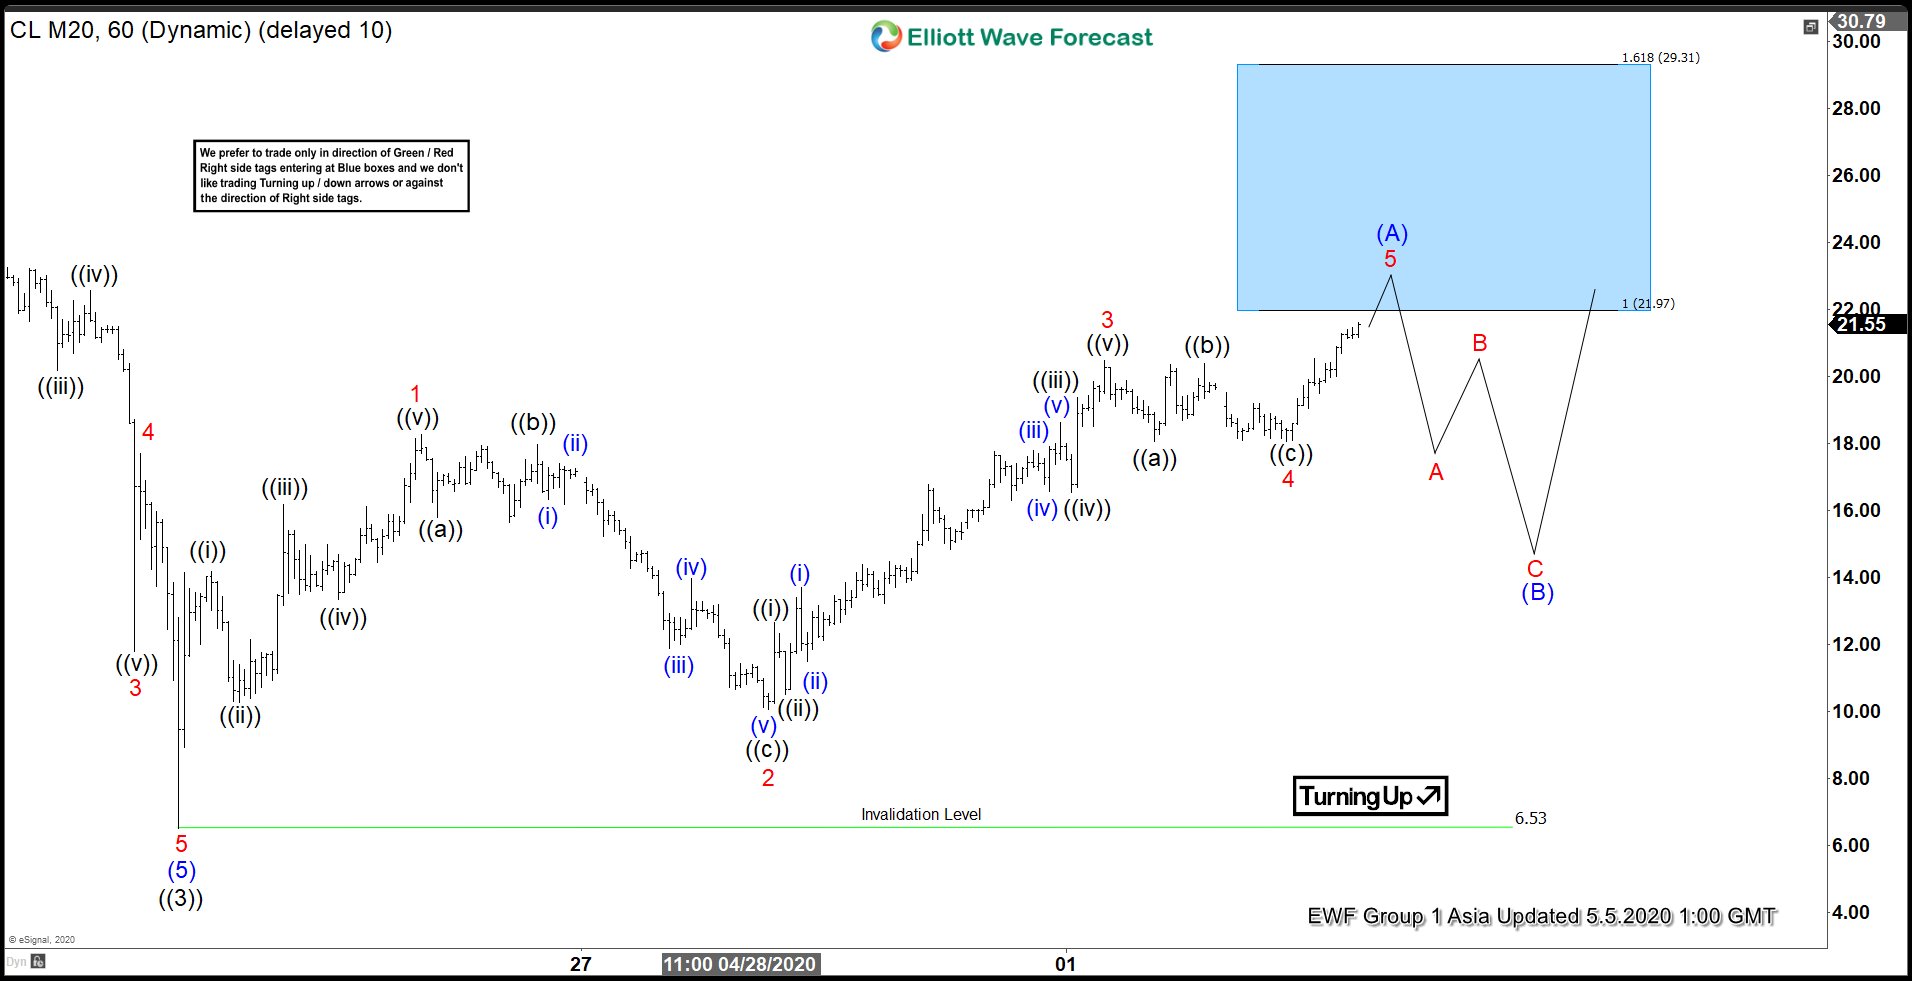
Short Term Elliott Wave outlook in Oil (CL_F) suggests the decline to $6.53 ended wave ((3)). Wave ((4)) recovery is unfolding as a zigzag Elliott Wave structure where wave (A) is currently in progress as a leading diagonal Elliott Wave structure. Leading diagonal can happen within wave (A) or wave (1) in larger degree and is usually characterized by overlapping wave 1 and 4, as well as the wedge shape. However, overlap between wave 1 and 4 is not a condition for a leading diagonal.
Up from wave ((3)) at 6.53, wave 1 ended at 18.26 as another leading diagonal in lower degree. Pullback in wave 2 ended at 10.7 as a zigzag. Oil then resumes higher in wave 3 towards 20.48 as an impulse and pullback in wave 4 ended at 18.05. Final leg wave 5 is in progress and may complete at 23.9 – 29.3 area. This can also end wave (A) of the zigzag in larger degree then it should see a wave (B) pullback to correct cycle from 4.22.2020 low before the rally resumes. As far as pivot at 6.53 low stays intact, expect dips to find buyers in 3, 7, 11 swing for another leg higher.
Oil 60 Minutes Elliott Wave Chart