BMW is one of the biggest german car manufacturers excelling in quality and technical characteristics. From march 2015, the performance of the stock price $BMW being part of DAX is, however, in a steady decline. As a matter of fact, this price development may be a real headake for company leaders. And still, disregarding all the fundamentals, one can explain the fall in the stock price in terms of pure technial analysis.
BMW Monthly Elliott Wave Analysis 04.24.2020
The monthly chart below shows the BMW stock $BMW traded at XETRA. From all-time lows, the stock price has developed an Elliott wave motive wave pattern. The cycle up in blue wave (I) being of super cycle degree has ended by printing its top at all-time highs on March 2015 at 123.80. Within the super cycle (I), the red waves I, III and V of cycle degree are also motive waves. Moreover, wave III shows an extension. Between wave V and wave III, one can see a divergence in RSI. All these characteristics support the maturity of the super cycle in wave (I). After 5 waves up, according to Elliott wave principle, the price needs to retrace in 3 waves lower. Only then another advance higher can start.

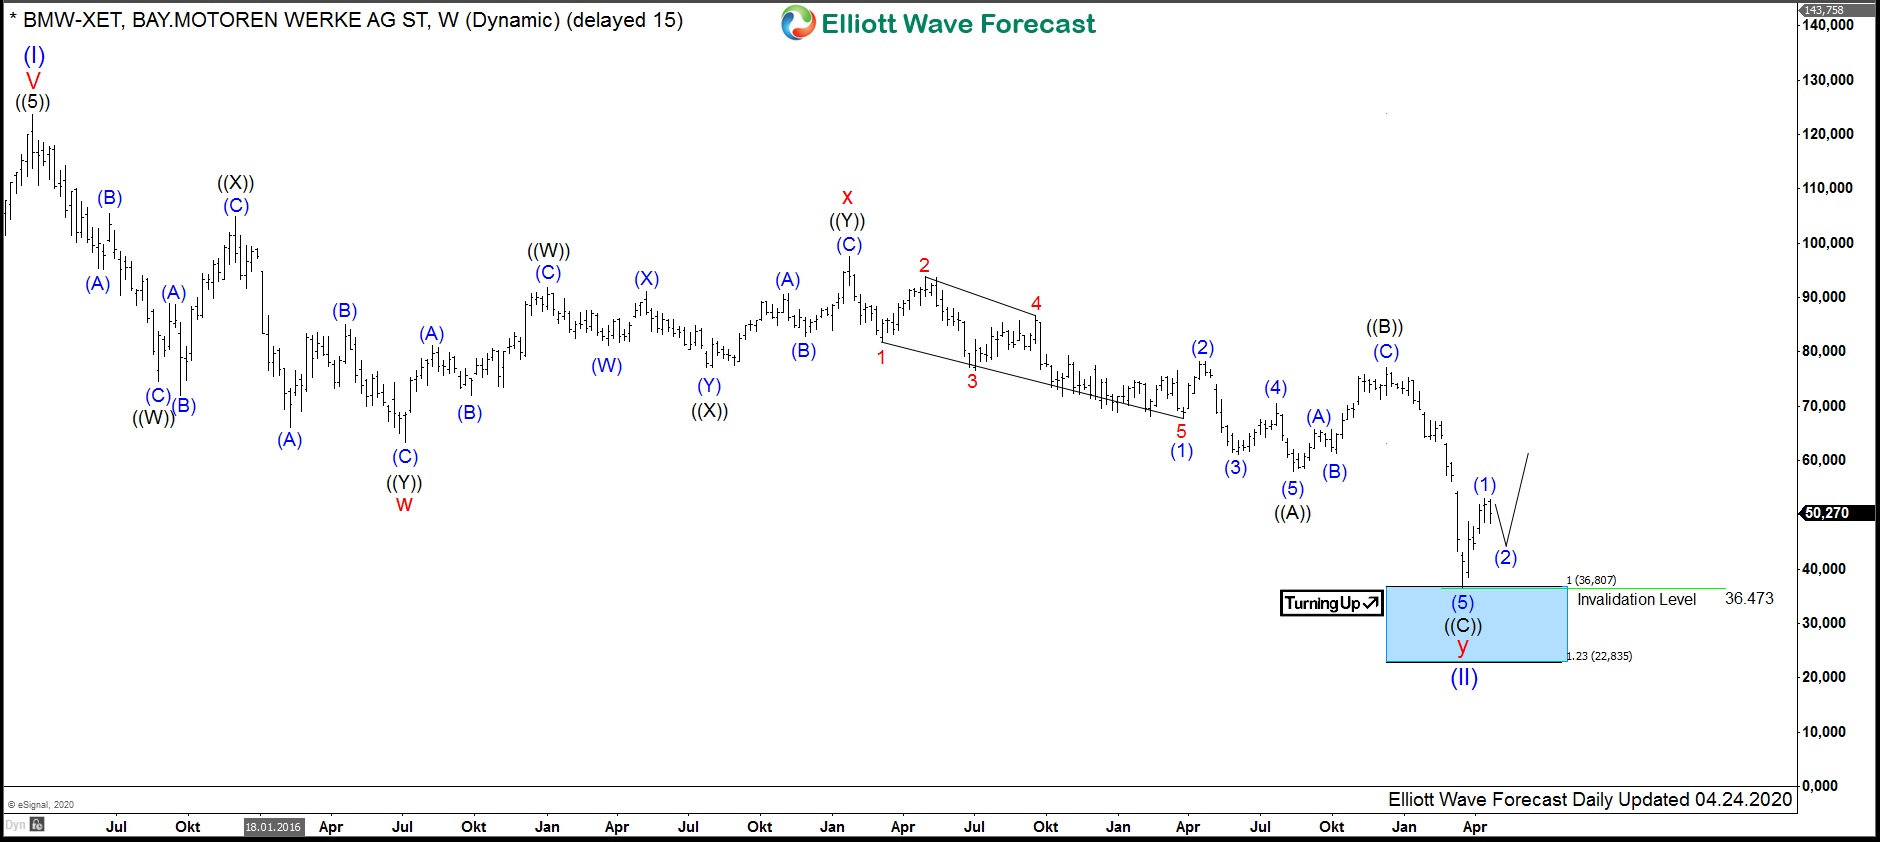
BMW Weekly Elliott Wave Analysis 04.24.2020
The correction of the super cycle in wave (I) from the 03.2015 highs in blue wave (II) lower can be better seen in detail in the weekly chart below. The decline has unfolded so far as a double three correction pattern, i.e., a 7 swings structure. The red wave w (3 swings) has ended on 07.2016. A connector in red wave x (swing #4) has printed its top on 01.2018. From there, the 5th swing lower in black wave ((A)) has ended on 08.2019 opening up a bearish sequence. After a bounce as a swing #6 in wave ((B)), the 7th swing in black wave ((C)) has extended lower. The red wave y has already reached the extension area towards 36.80-22.83. From the 03.2020 lows, we saw a strong reaction to the upside.
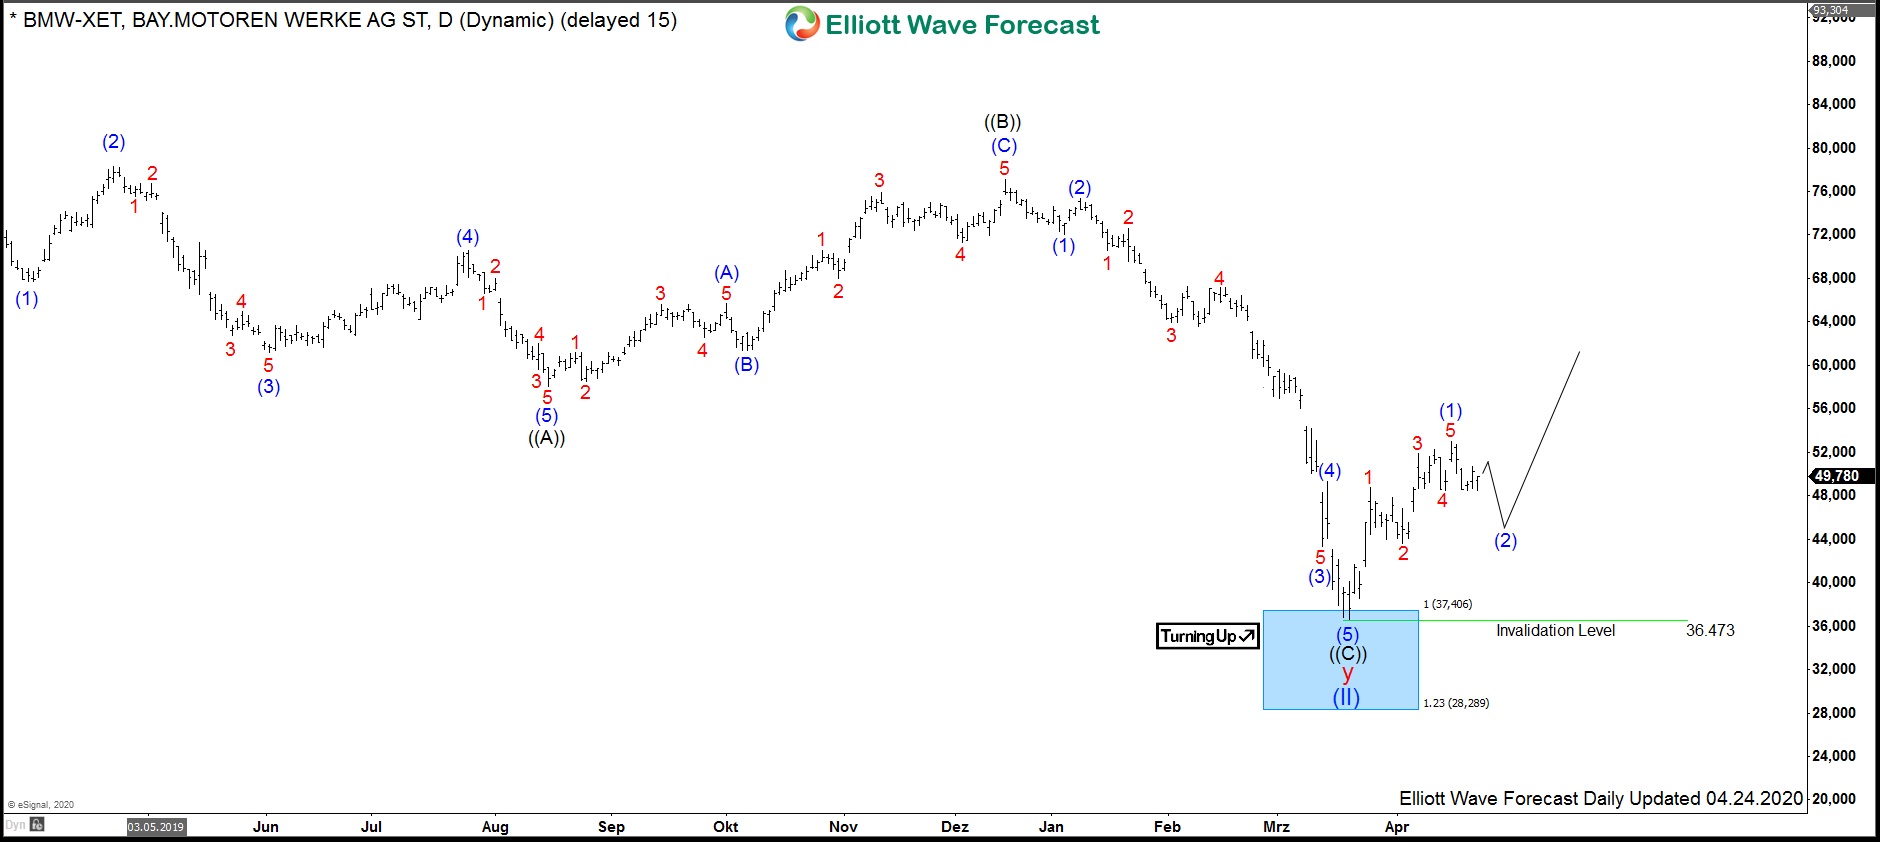
BMW Daily Elliott Wave Analysis 04.24.2020 and Outlook
The daily chart below shows that even within the wave y of cycle degree the waves ((A)) and ((C)) have reached the equal legs extension area towards 37.40-28.29. The price may have, therefore, printed an important bottom in wave (II) on 03.2020 at 36.47. While above, where daily, weekly and monthly are turning up, the stock is expected to resume the rally in wave (III) towards 123.80 and higher or bounce in 3 waves at least.