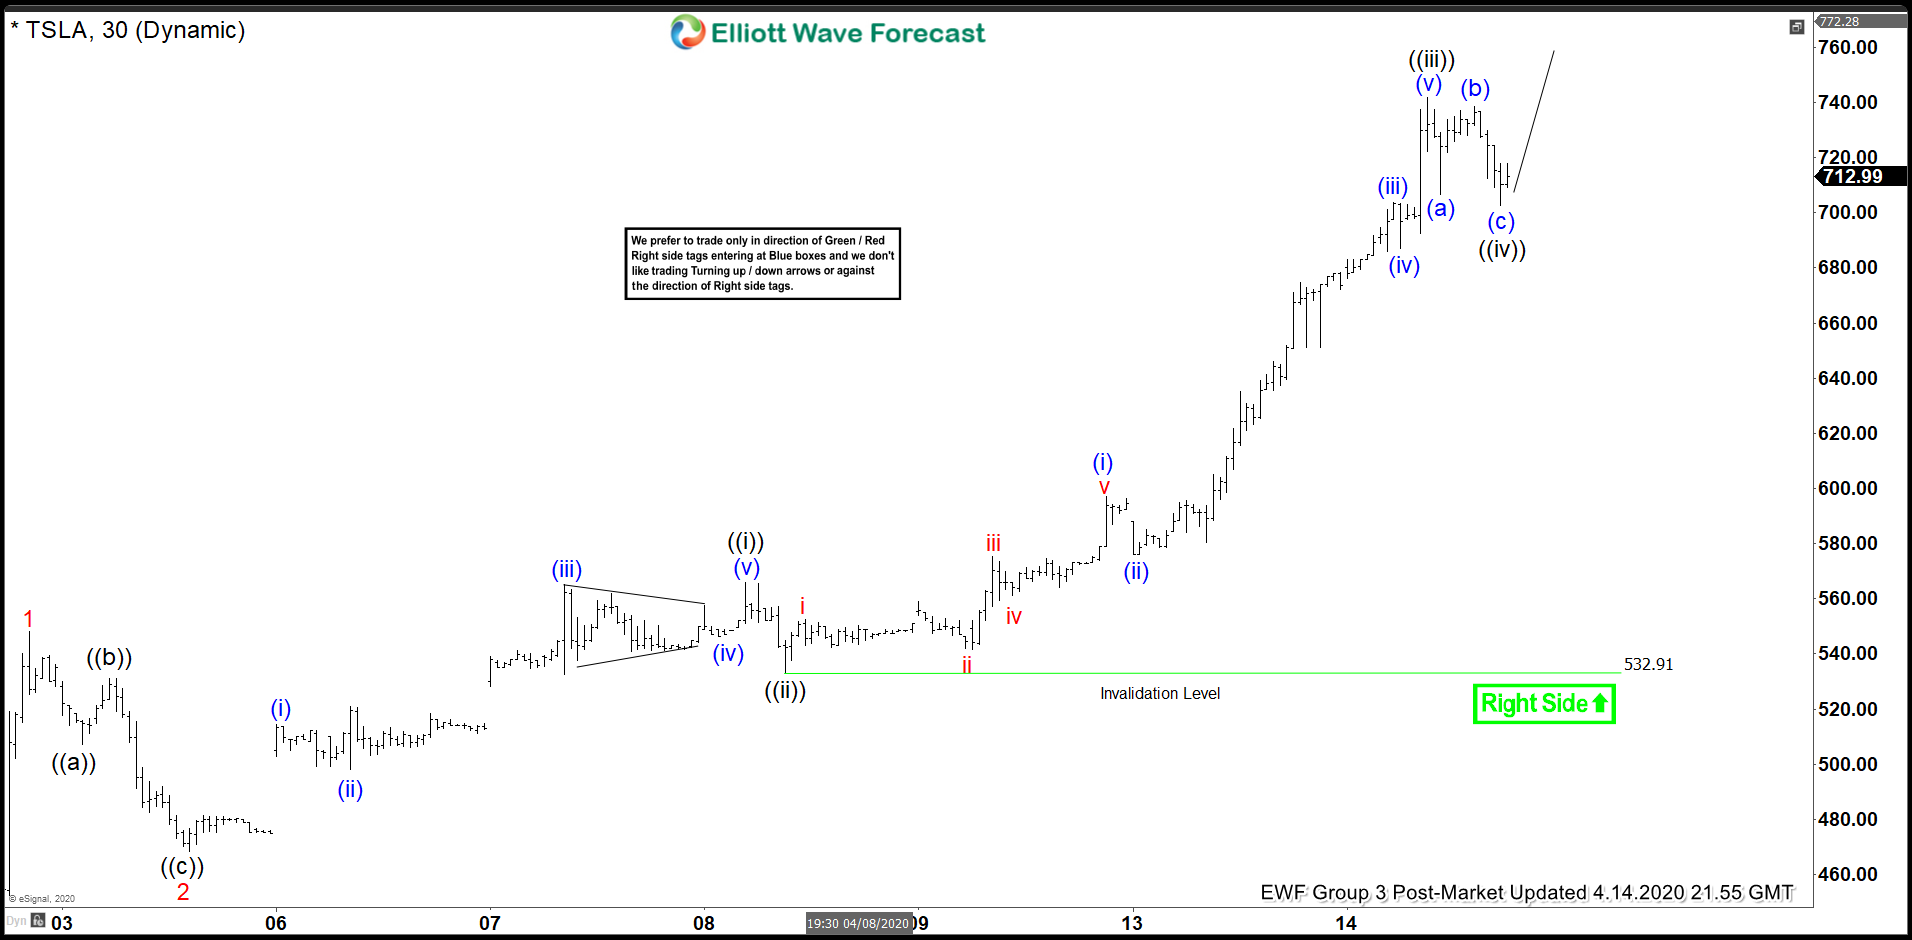
Short Term Elliott Wave View suggests rally in Tesla (Ticker: TSLA) from April 3 low is unfolding as a 5 waves impulse Elliott Wave structure. Up from April 3 low, wave 1 ended at 547.97. Wave 2 pullback ended at 468.39 low. The stock has resumed higher in wave 3 which subdivides into another 5 waves Up from 468.39, wave (i) ended at 513.17 and wave (ii) pullback ended at 497.96. Stock then resumed higher in wave (iii) which ended at 565 and wave (iv) pullback ended at 546.21. The last leg wave (v) ended at 566 which ended wave ((i)) in higher degree.
From there, pullback in wave ((ii)) ended at 532.91 and the stock resumed higher again in wave ((iii)) as a 5 waves.. Up from 532.91, wave (i) ended at 597, and wave (ii) pullback ended at 576.21. Wave (iii) rally ended at 703.8, wave (iv) ended at 687, and wave (v) of ((iii)) ended at 741.88. Stock then pullback in wave ((iv)) towards 702.77 and resumes higher again afterwards.
Near term, while dips stay above 532.91, expect the stock to extend higher in wave ((v)) before ending wave 3. It should then pullback in wave 4 then extend higher again in wave 5. As far as pivot at 532.91 stays intact, expect the stock to extend higher and dips to find support in 3, 7, or 11 swing.
Tesla (TSLA) 1 Hour Elliott Wave Chart