
$FXA Bearish Cycles From The July 2011 High
First the FXA ETF fund is the Australian dollar tracking fund that has an inception Date of 06/21/2006. With that said the fund mainly reflects the currency spot price of the AUDUSD forex pair. The data available from the Reserve Bank of Australia at their website suggests the spot price was 1.4875 back in 1973 to 1974 translates into an FXA price of around 148.75. Obviously that is a long term downtrend. The bearish cycle analysis suggests it can go lower to possibly retest those lows eventually.
Back before the FXA fund inception date, the AUDUSD spot currency price reached what is still the currency low in April 2001 at .4778. From there the currency pair went up in three swings until July 2011 at a high of 1.1080. That translates into the FXA ETF fund price high of 110.99 in July 2011. This is where the monthly Elliott wave analysis begins on the chart below.
The analysis continues below the monthly chart.
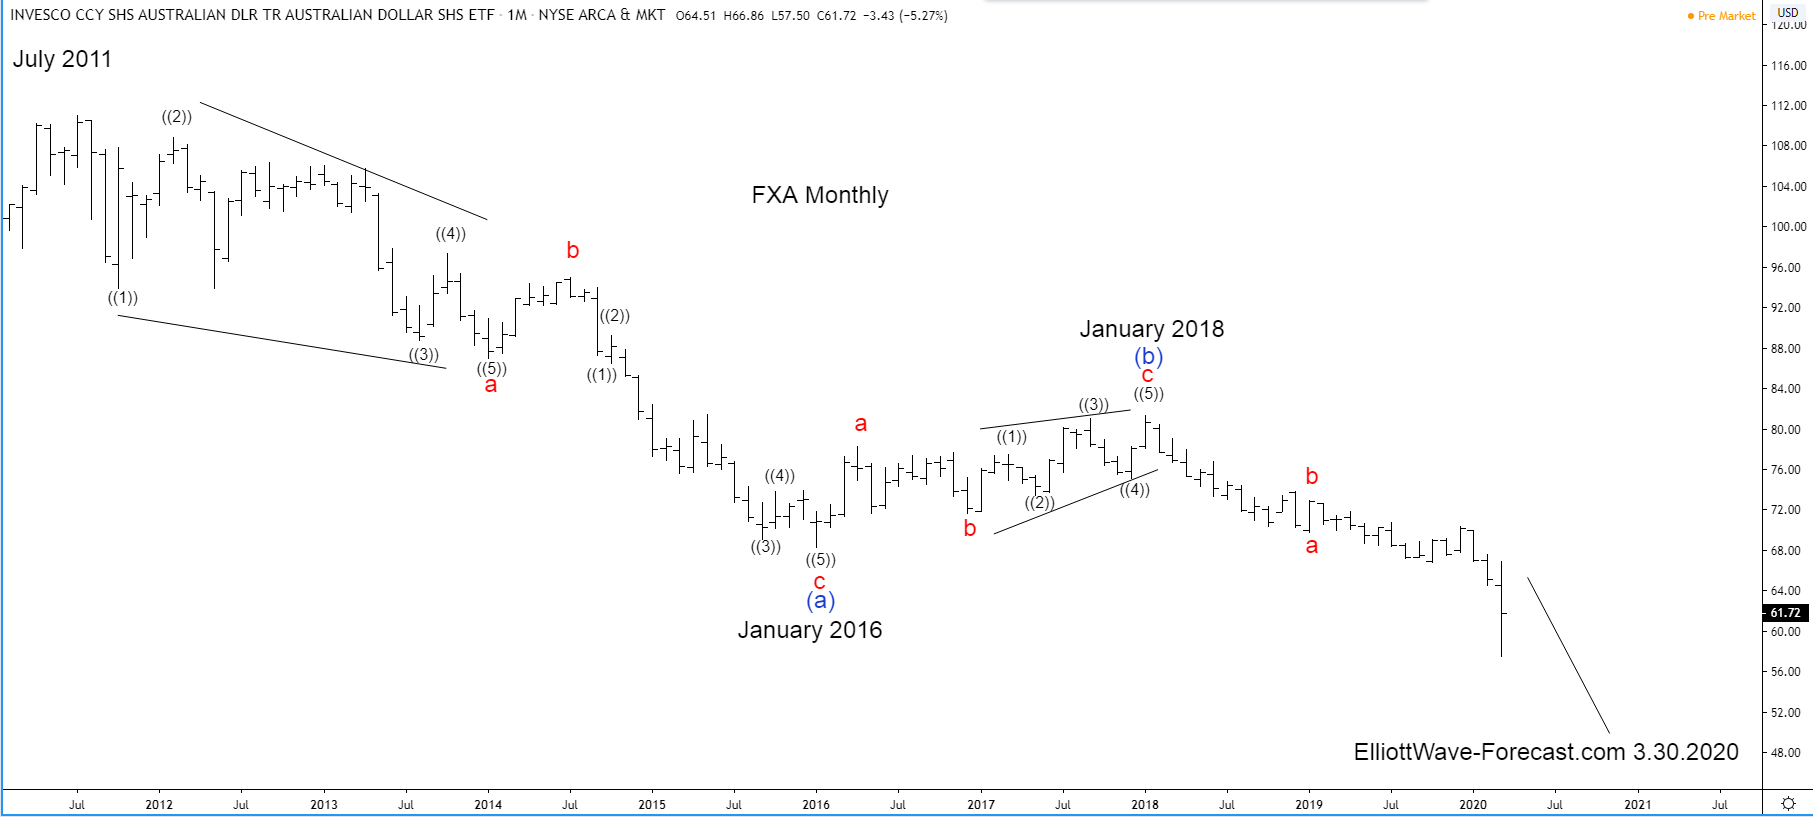
Secondly the decline from the aforementioned July 2011 highs does not seem legitimately able to count the whole cycle from there down to the January 2016 lows as a regular impulse by itself as a whole. The cycle lower in the blue wave (a) has been subdivided as an a-b-c in red. The instrument has since then bounced in three swings in what appeared to be a zig zag Elliott wave (b) that ended in January 2018.
The analysis continues below the weekly chart.
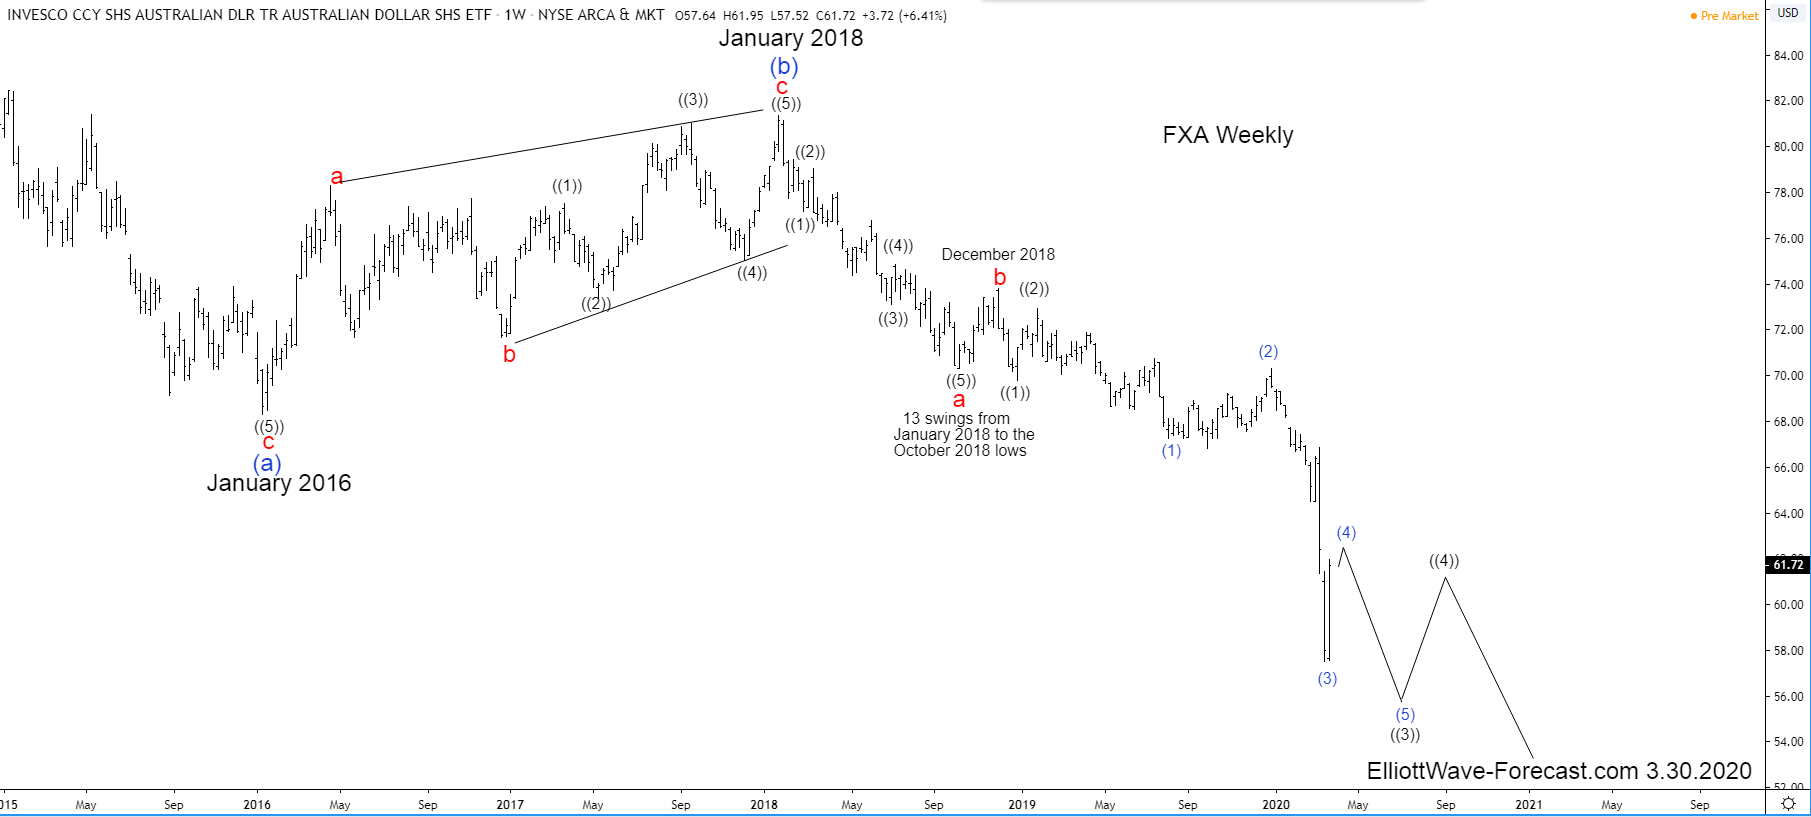
Thirdly since the wave (b) highs from January 2018 the instrument has declined in a relatively clean & clear 5 wave impulse in wave a to the October 2018 lows. A bounce to the December 2018 highs was technically strong. It suggested it was correcting the cycle from the January 2018 highs. The new lows since then gives it a bearish sequence to go along with the down trend.
In conclusion the equal legs of the larger blue (a) -(b) on the two charts shown above comes in at the 38.70 area. The 61.8 extension area of the (a)-(b) is at 55.00. This is a place where price may stall a little during the decline. The decline should continue lower most immediately while below the 12/31/19 highs, more importantly while below the December 2018 highs.