
In this technical blog, we are going to take a look at the past performance of IBEX 1-Hour Elliott wave Charts. That we presented to our members. In which, the decline from the 2/19/2020 peak took place as a corrective structure in the initial stage. But showed a lower sequence with a bearish sequence stamp with right side tag pointing lower called for more downside to take place. Therefore, our members knew that the sequence is incomplete. And selling the intraday bounce in 3 or 7 swings into the direction of the right side tag remained the preferred path. We will explain the Elliott wave structure & selling opportunity our members took below.
IBEX 1 Hour Elliott Wave Chart
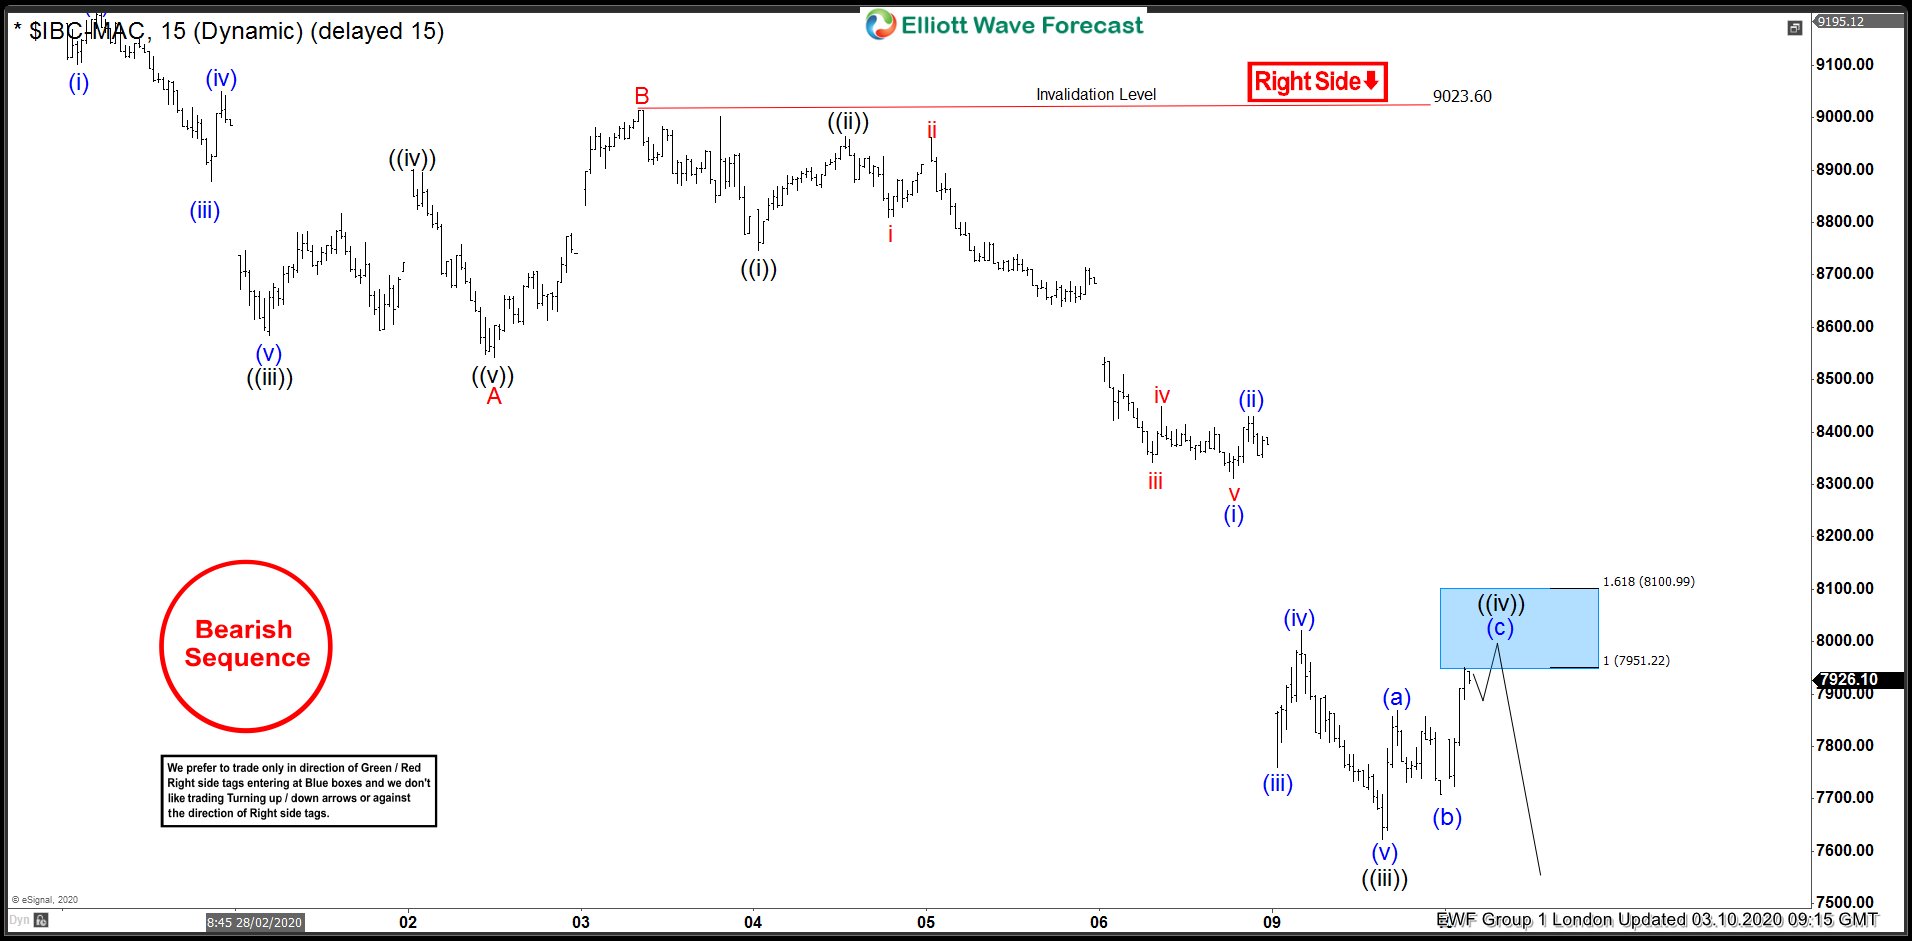
IBEX 1 Hour Elliott Wave Chart from 3/10/2020 London update. In which, the decline from the February peak took place as Elliott wave zigzag structure with an incomplete structure to the downside. Wave A ended at 8541 low, wave B bounce ended at 9023 high. The internals of wave C unfolded in 5 waves impulse structure. While wave ((i) ended at 8746. Wave ((ii)) ended at 8963 high, wave ((iii)) ended at 7622 low. Wave ((iv)) was expected to end at 7951-8100 100%-161.8% Fibonacci extension area. From there, the index was expected to see sellers looking for more downside in the index.
IBEX 1 Hour Elliott Wave Chart
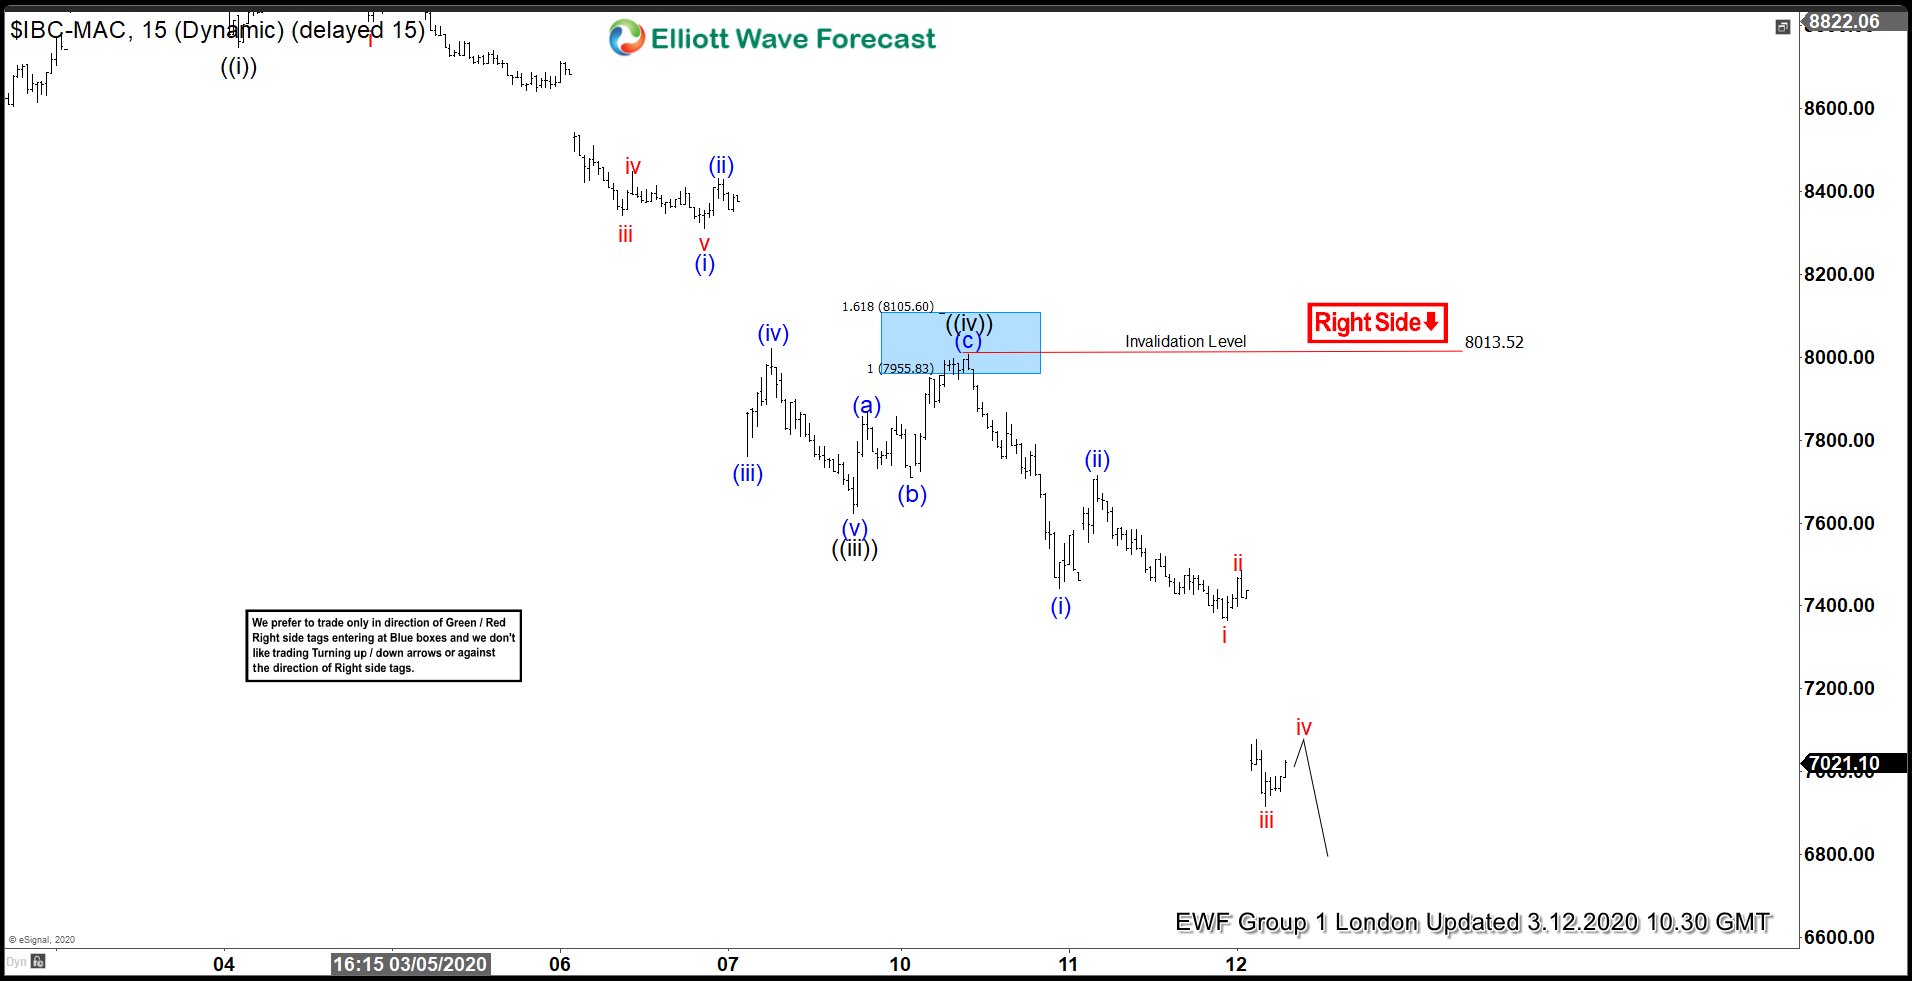
Here’s 1 Hour Elliott Wave Chart from 3/12/2020 London update. Showing the reaction lower taking place from the blue box area at 7951-8100. As we can clearly see that the index was able to make new lows. And index was able to reach the target at 7439 initial target area for shorts.