
In this technical blog, we are going to take a look at the past performance of VOX 1-Hour Elliott wave Charts that we presented to our members. In which, the decline from 2/18/2020 peak took place as a corrective structure and showed a lower sequence with a bearish sequence stamp with right side tag pointing lower called for more downside. Therefore, our members knew that selling the intraday bounces into the direction of the right side tag remained the preferred path. We will explain the Elliott wave structure & selling opportunity our members took below:
VOX 1 Hour Elliott Wave Chart
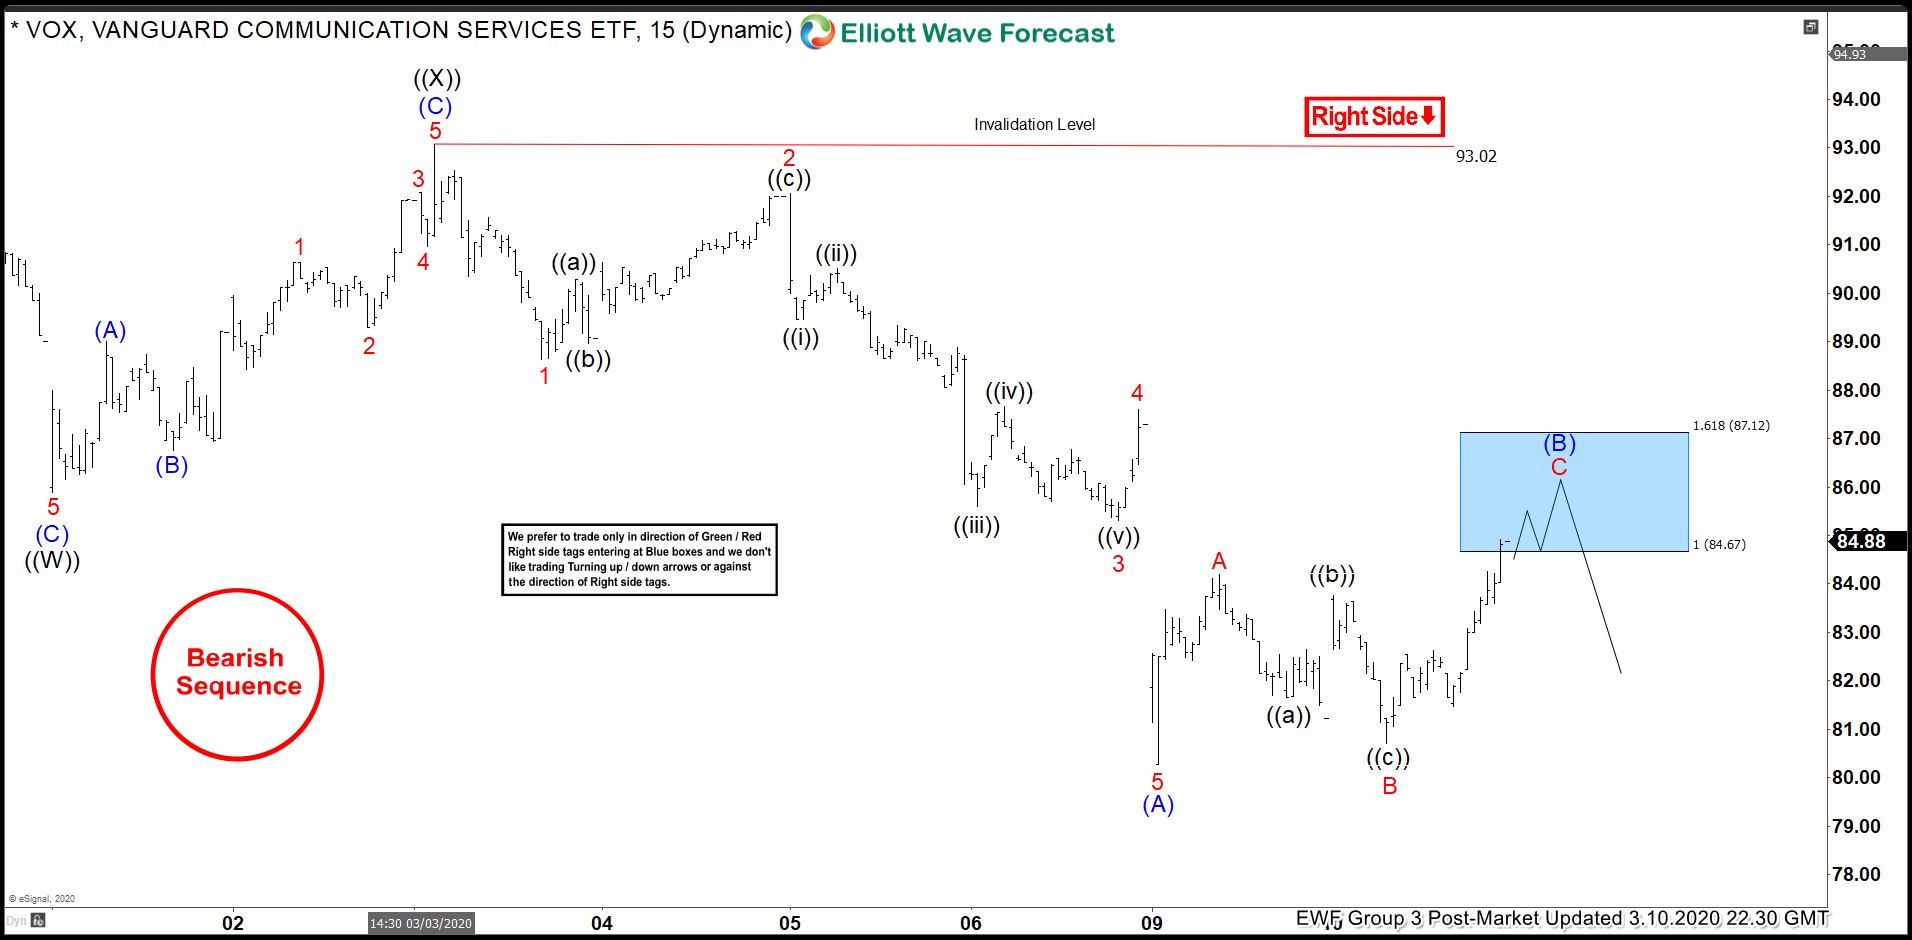
VOX 1 Hour Elliott Wave Chart from 3/10/2020 Post-Market update. In which the decline from February peak unfolded as Elliott wave double three structure where wave ((W)) ended at $85.88 low. Wave ((X)) bounce ended at $93.02 high. While wave ((Y)) unfolded as Elliott wave zigzag structure where wave (A) ended at $80.27 low. Wave (B) bounce also unfolded as a lesser degree zigzag structure and found sellers at $84.67-$87.12 100%-161.8% Fibonacci extension area of A-B.
VOX 1 Hour Elliott Wave Chart
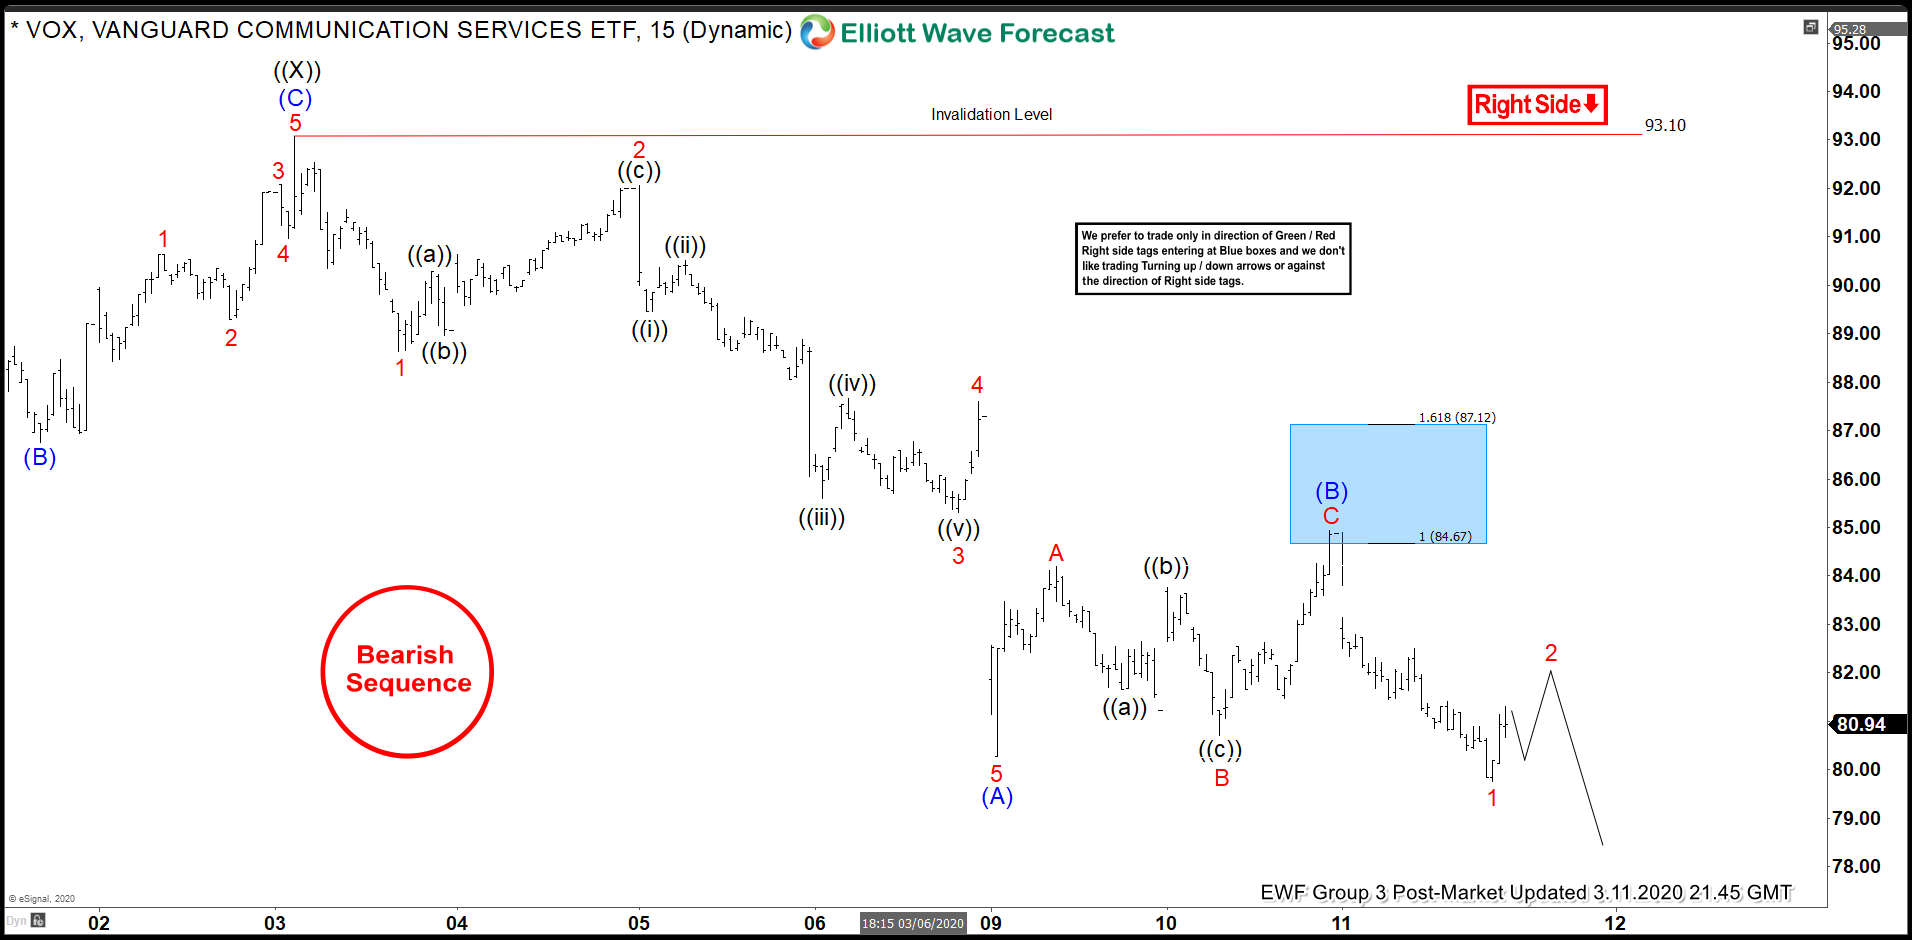
Here’s 1 Hour Elliott Wave Chart from 3/11/2020 Post-Market update. In which the wave (B) failed within the blue box area at $84.67-$87.12 & made new lows as expected. Allowed members to create a risk-free position shortly after taking the short trade.