The World Health Organization (WHO) has a declared the outbreak of the new corona virus a pandemic as health authorities around the globe continue to scramble to contain the sickness, first detected in the central Chinese city of Wuhan in December last year.
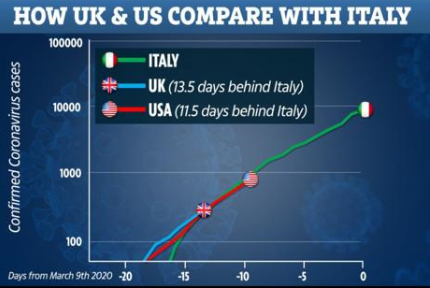
The virus, which causes a respiratory illness called COVID-19, has spread to at least 114 countries and territories on six continents, infecting more than 118,000 people and killing more than 4,200. The vast majority of infections and deaths have occurred in mainland China, where authorities placed a region of 60 million people under lockdown to contain the pathogen. The worst hit countries at the moment outside China are Italy, South Korea and Iran. However, the graph below shows that UK and US might not be that far behind Italy if the keeps spreading at the same pace.
Many industries like Hotels, Tourism and Airlines have been hit due to Corona virus and many countries either imposing travel bans or advising against un-necessary travel. However, Cruise Industry has probably been the hardest hit industry due to Corona virus starting with Diamond Princess Cruise Ship which went from from having 10 cases of the novel corona virus to more than 700 over the course of its two-week quarantine and the testing that followed (source www.businessinsider.com) and then the quarantine of Grand Princess Cruise Ship. Cruise ships normally operate without any or longer breaks and usually carry thousands of passengers in a limited space so it’s very easy for diseases like COVID-19 to spread on Cruise Ships. Royal Caribbean Cruise is one such cruise company which has taken a big hit dropping from 135.32 on 17th January 2020 to 29.01 on 12th March 2020. With such a massive decline, we look at the waves to see what they are suggesting about the stock.
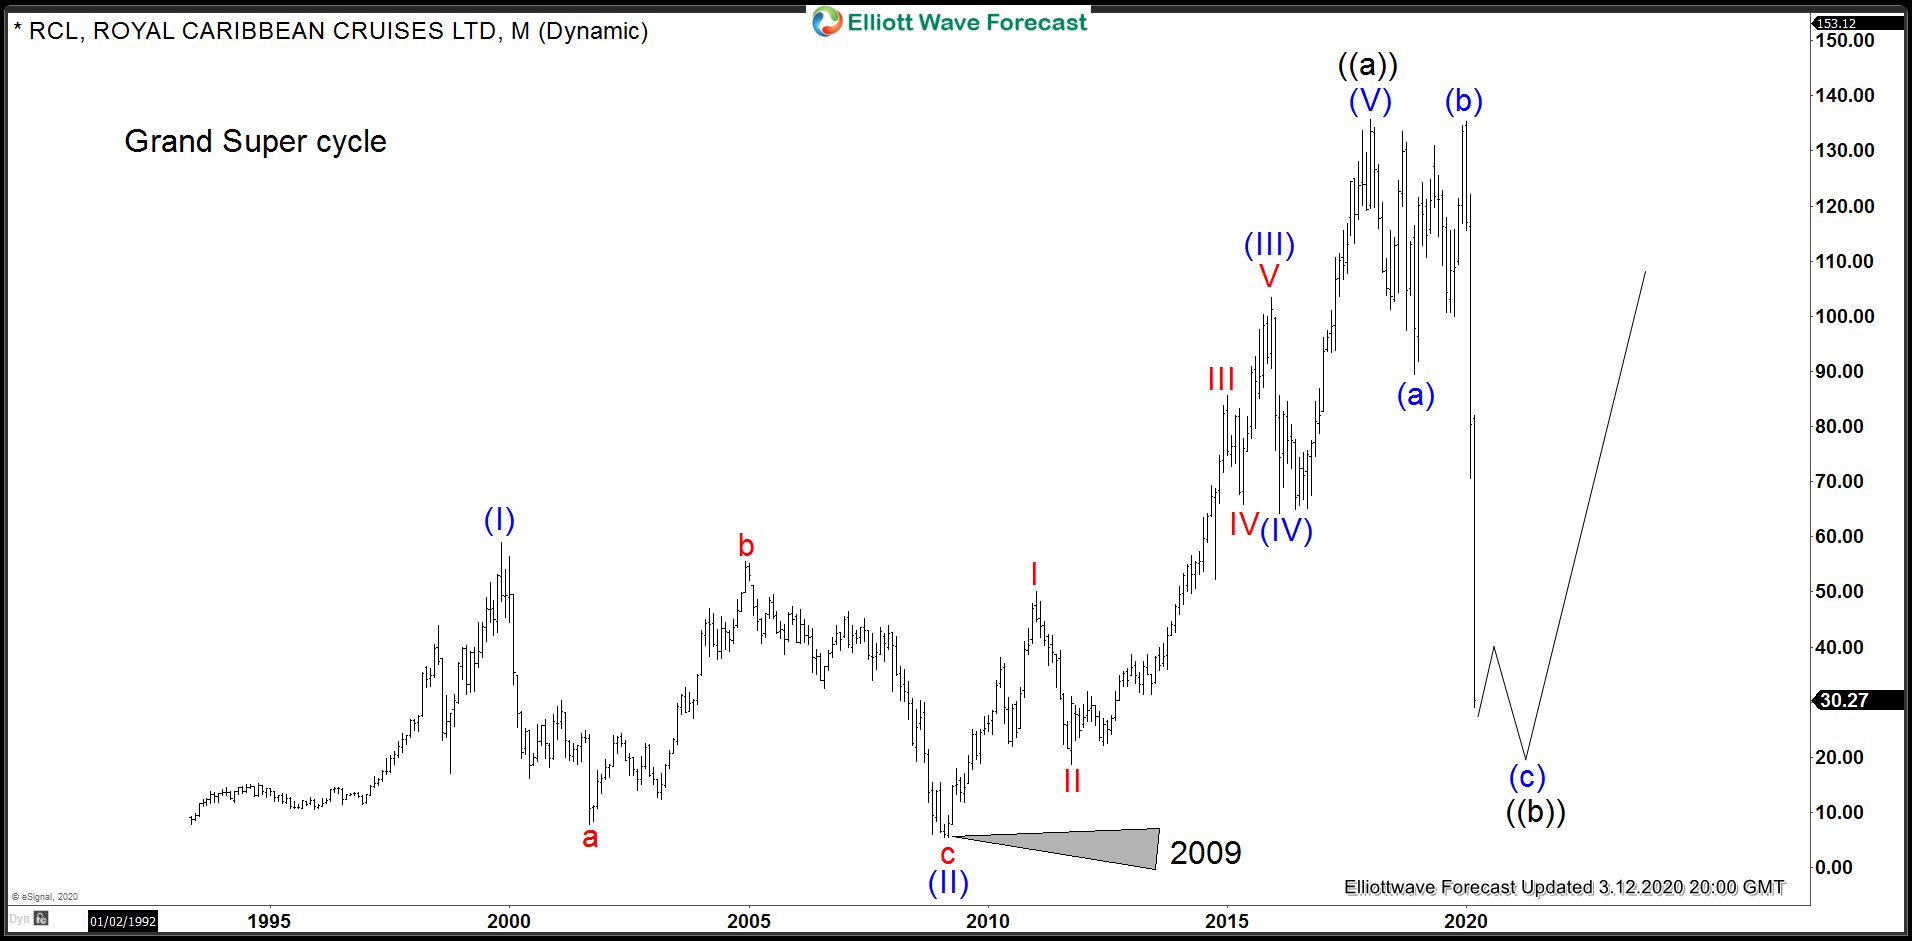
Royal Caribbean Cruises (RCL) Elliott Wave Analysis (Monthly Chart)
Long-term view suggests RCL has completed a 5 waves advance from it’s all time low back in 1993 and it is now correcting that cycle. The initial decline from 135.65 to 89.48 was in 3 waves followed by a full test of 135.65 and then a sharp decline which supports the idea of a 3-3-5 Elliott Wave FLAT correction lower from 135.65 peak with wave (c) still in progress. Wave structure in Carnival Cruises (CCL) is an ABC from the peak but it does the support the idea of a FLAT in RCL as we explain in the video at the bottom of this page. Alternatively, the decline from the peak at 135.65 could become 5 waves and just be 1st leg of the larger 3 waves pull back. It’s not impossible but unless wave (b) did a deep test of 135.65 peak, there wouldn’t allow a room for ( c ) leg lower unless RCL went bankrupt.
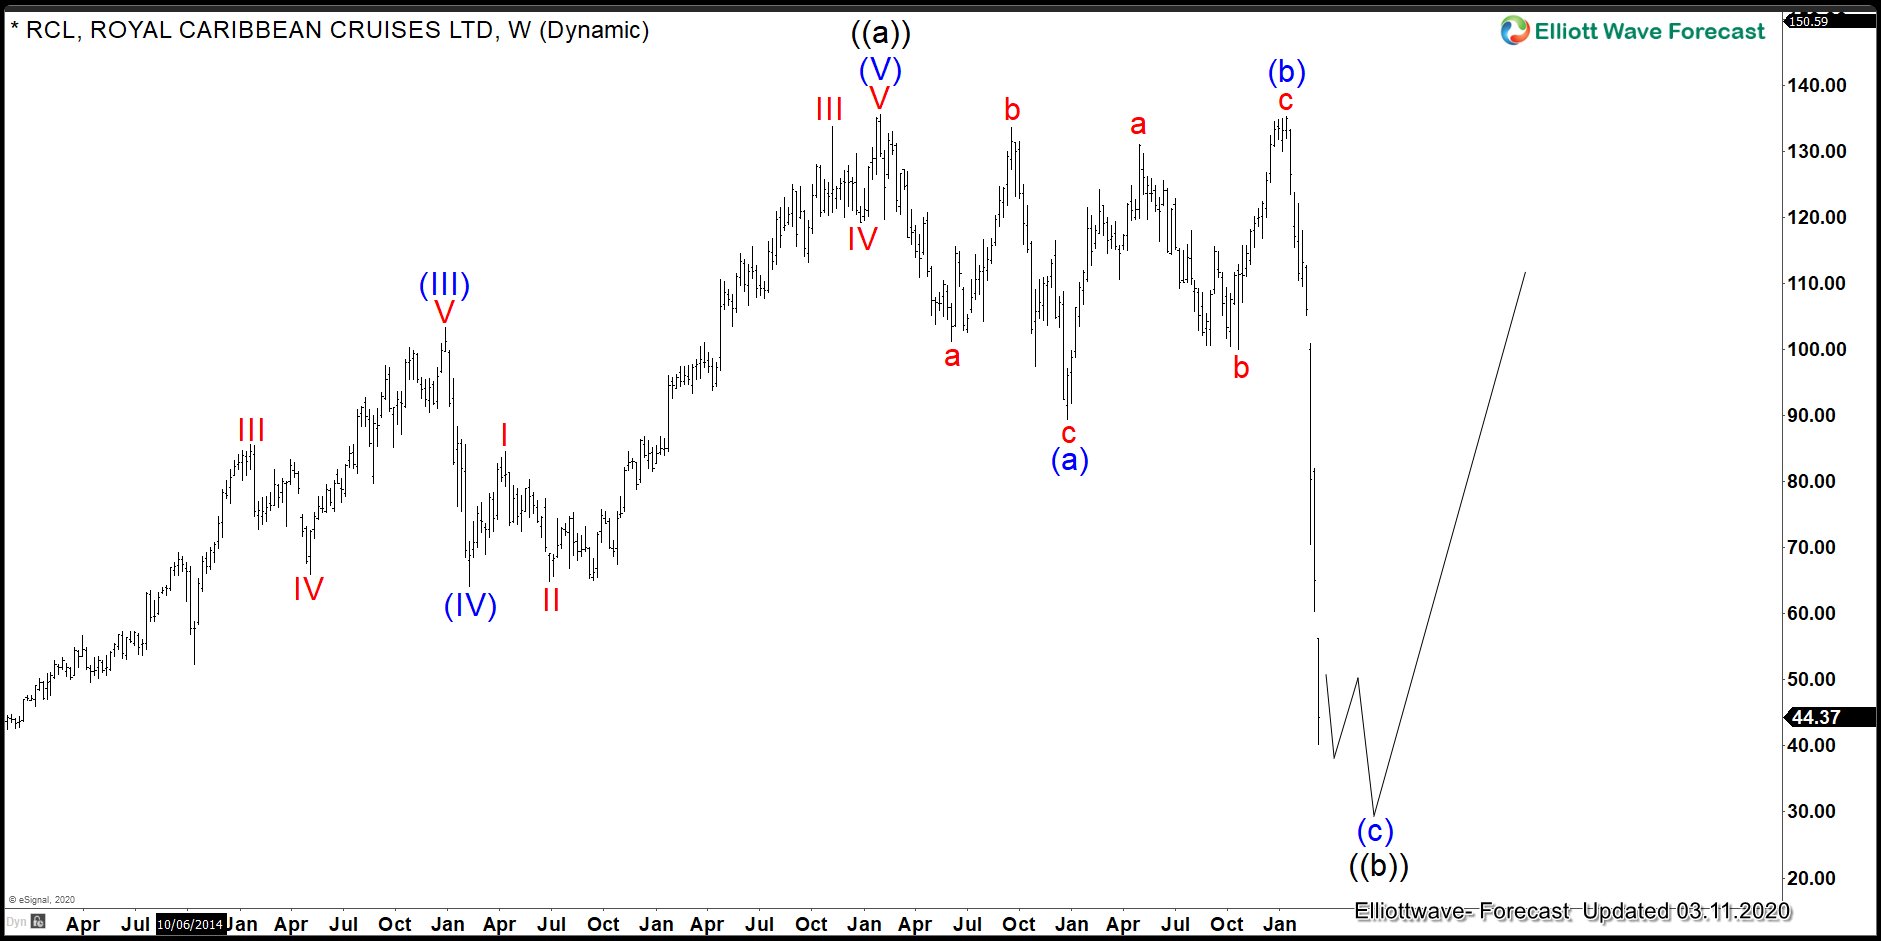
Royal Caribbean Cruises (RCL) Elliott Wave Analysis (Weekly Chart)
Chart below shows a closer look at the structure of the decline from 135.65 peak, we can see the decline from wave ((a)) high to blue (a) was clearly in 3 waves as explained above and the decline from wave (b) high so far appears to be in 3 waves.
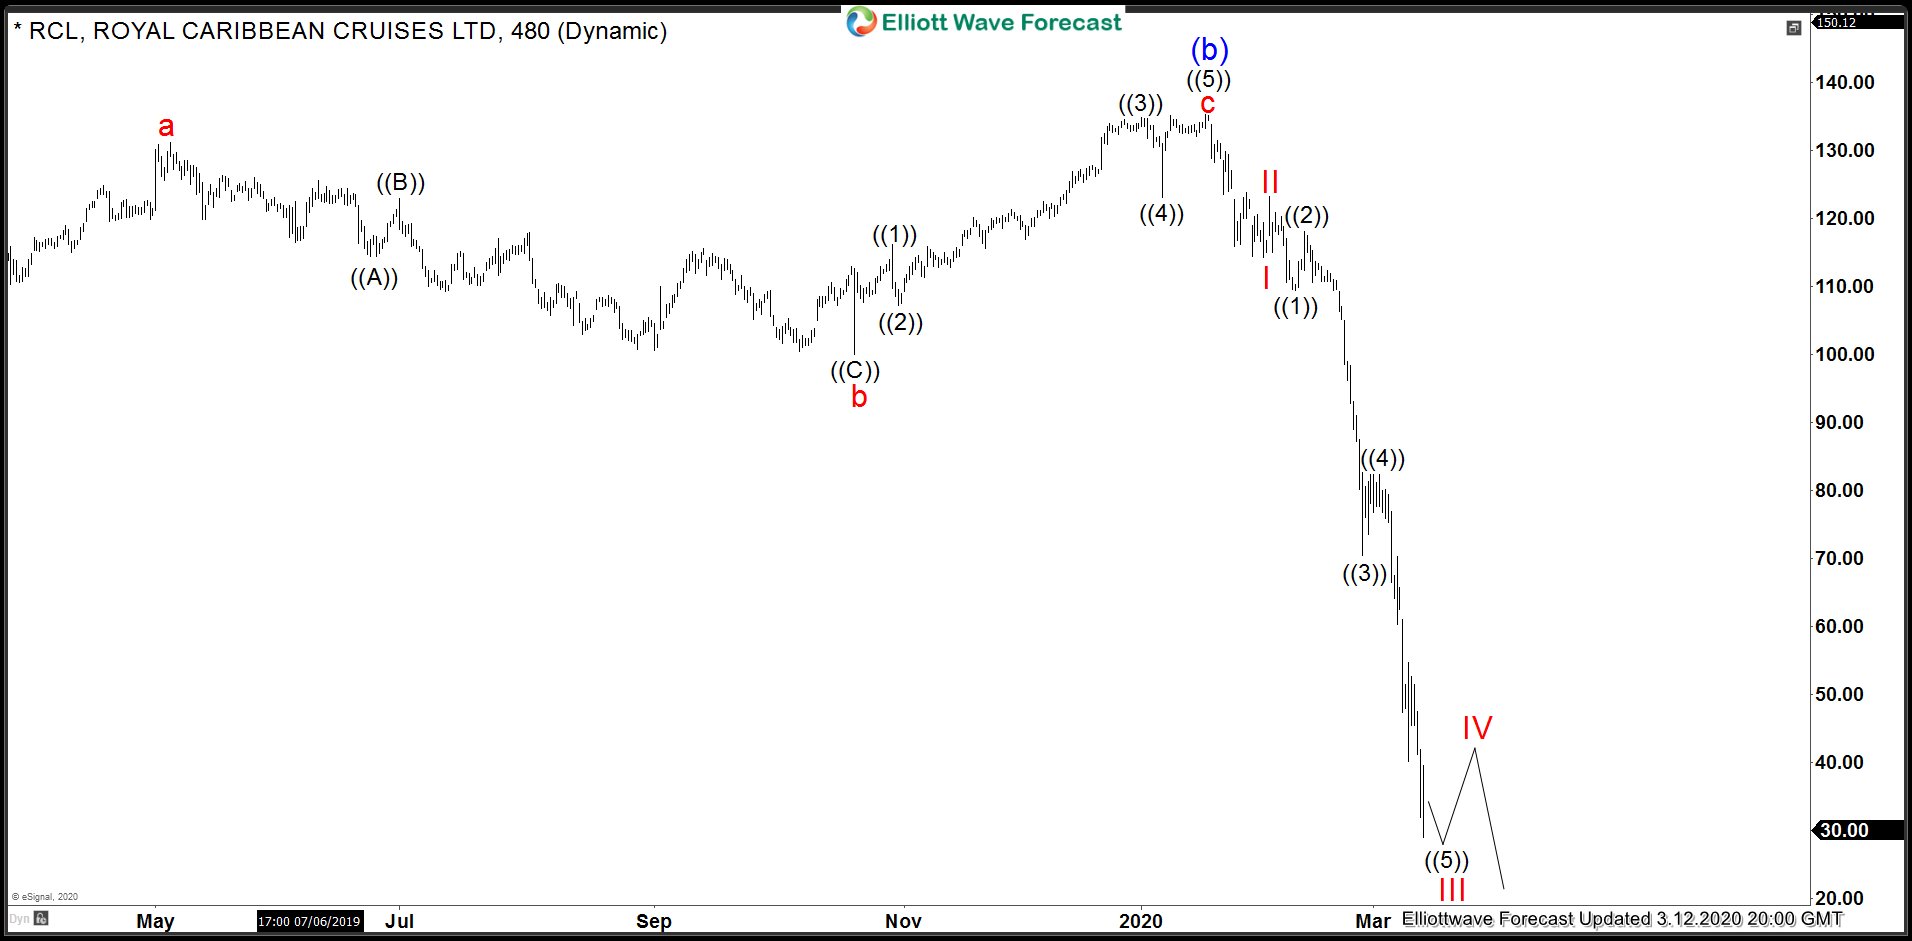
Royal Caribbean Cruises (RCL) Elliott Wave Analysis (480 minutes)