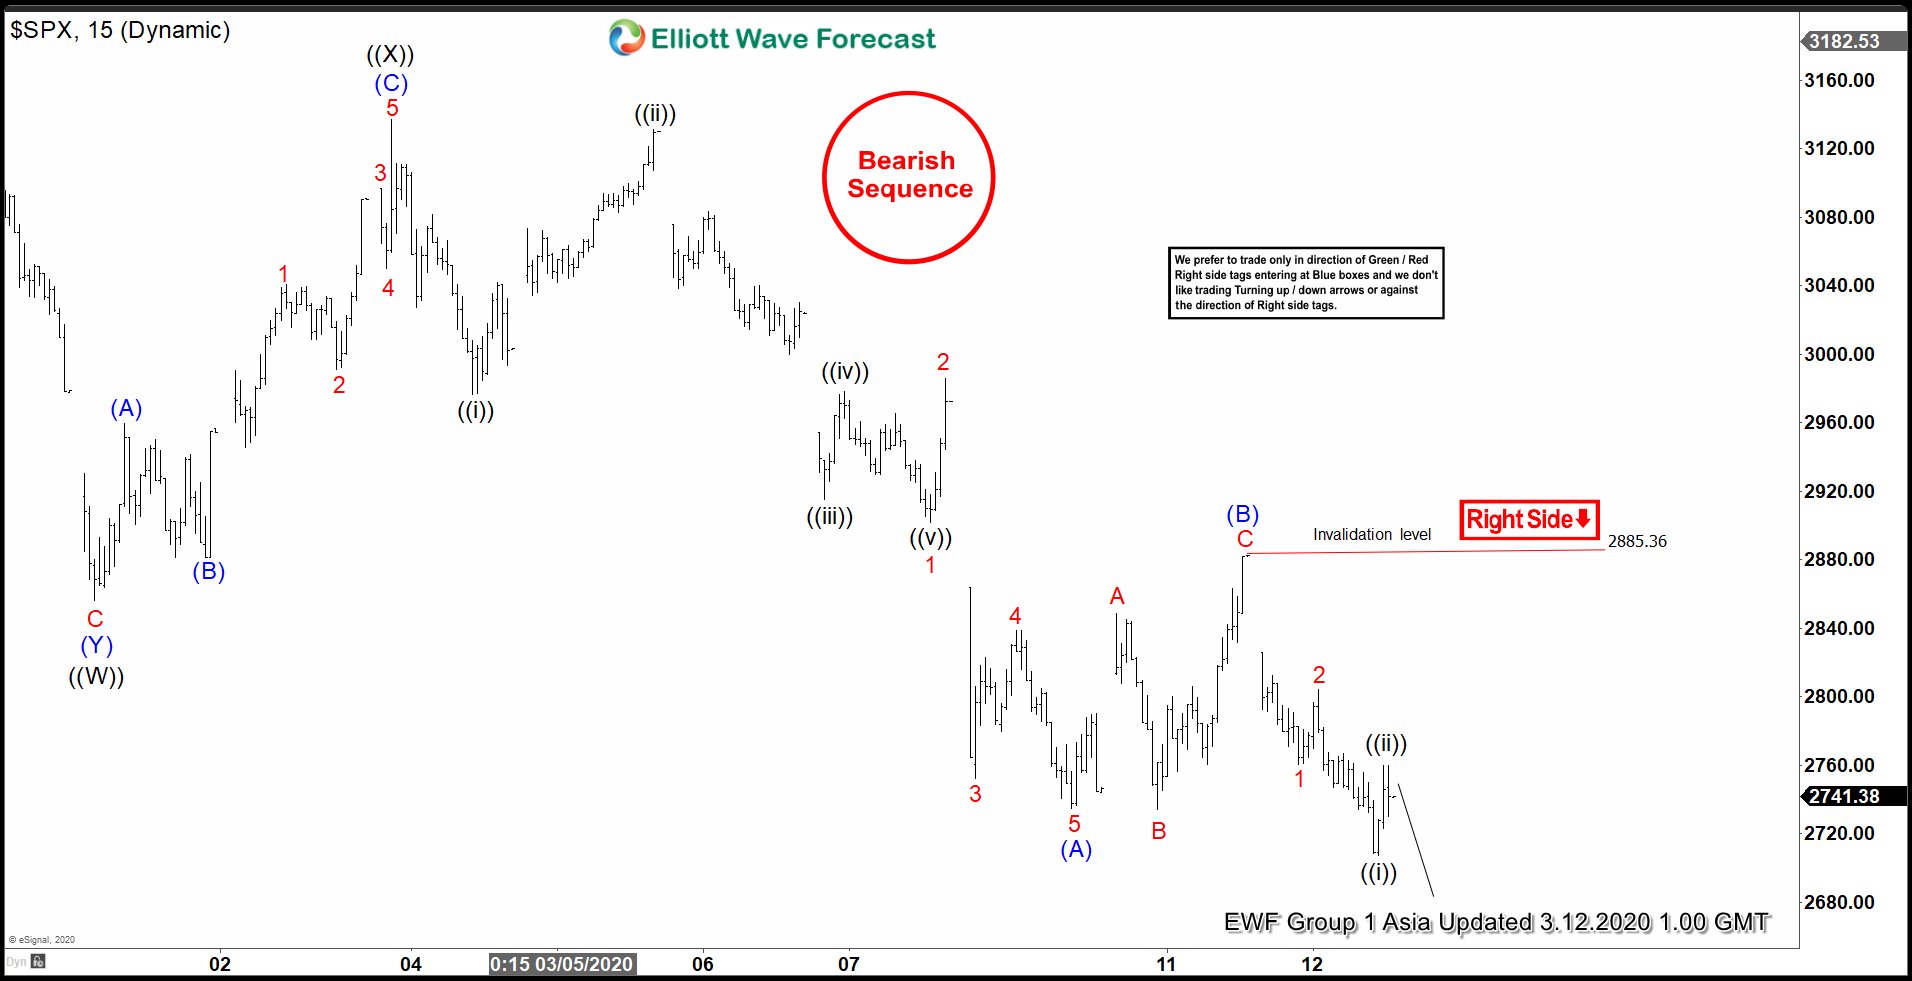
Short term Elliott Wave view in S&P 500 (SPX) suggests cycle from February 19, 2020 high is unfolding as a double three Elliott Wave structure. Down from February 19, 2020 high, wave ((W)) ended at 2855 low. The bounce in wave ((X)) ended at 3136 high. From there, the Index has extended lower and broken below previous wave ((W)) low. The Index now has a bearish sequence. Wave ((Y)) is unfolding as a zig-zag. Wave (A) of ((Y)) ended at 2734 low. The internal subdivision of wave (A) unfolded as a 5 waves impulse Elliott Wave structure. Wave 1 ended at 2901 low and the bounce in wave 2 ended at 2985 high. The index then extended lower in wave 3, which ended at 2752 low and followed by a bounce in wave 4, which ended at 2838 high. The index then pushed lower in wave 5 and ended at 2734 low.
Up from that low, the Index bounced in wave (B) as a flat and ended at 2885 high. Currently, the Index has broken below wave (A) low to confirm wave (C) is in progress. Wave 1 of (C) ended at 2760 low and wave 2 bounce ended at 2804 high. While below 2885 high, expect the bounce in 3,7, or 11 swings to fail and SPX to continue to extend lower. The 100% – 161.8% Fibonacci extension of wave ((W))-((X)) which comes at 2260-2596 area can slow down the decline. The index then can consolidate and can possibly bounce in 3 waves at least from that area. However, if the Index breaks below 1.618 extension (2260), the decline risks becoming 5 waves down and the Index can continue to see more downside.
SPX 1 Hour Elliott Wave Chart