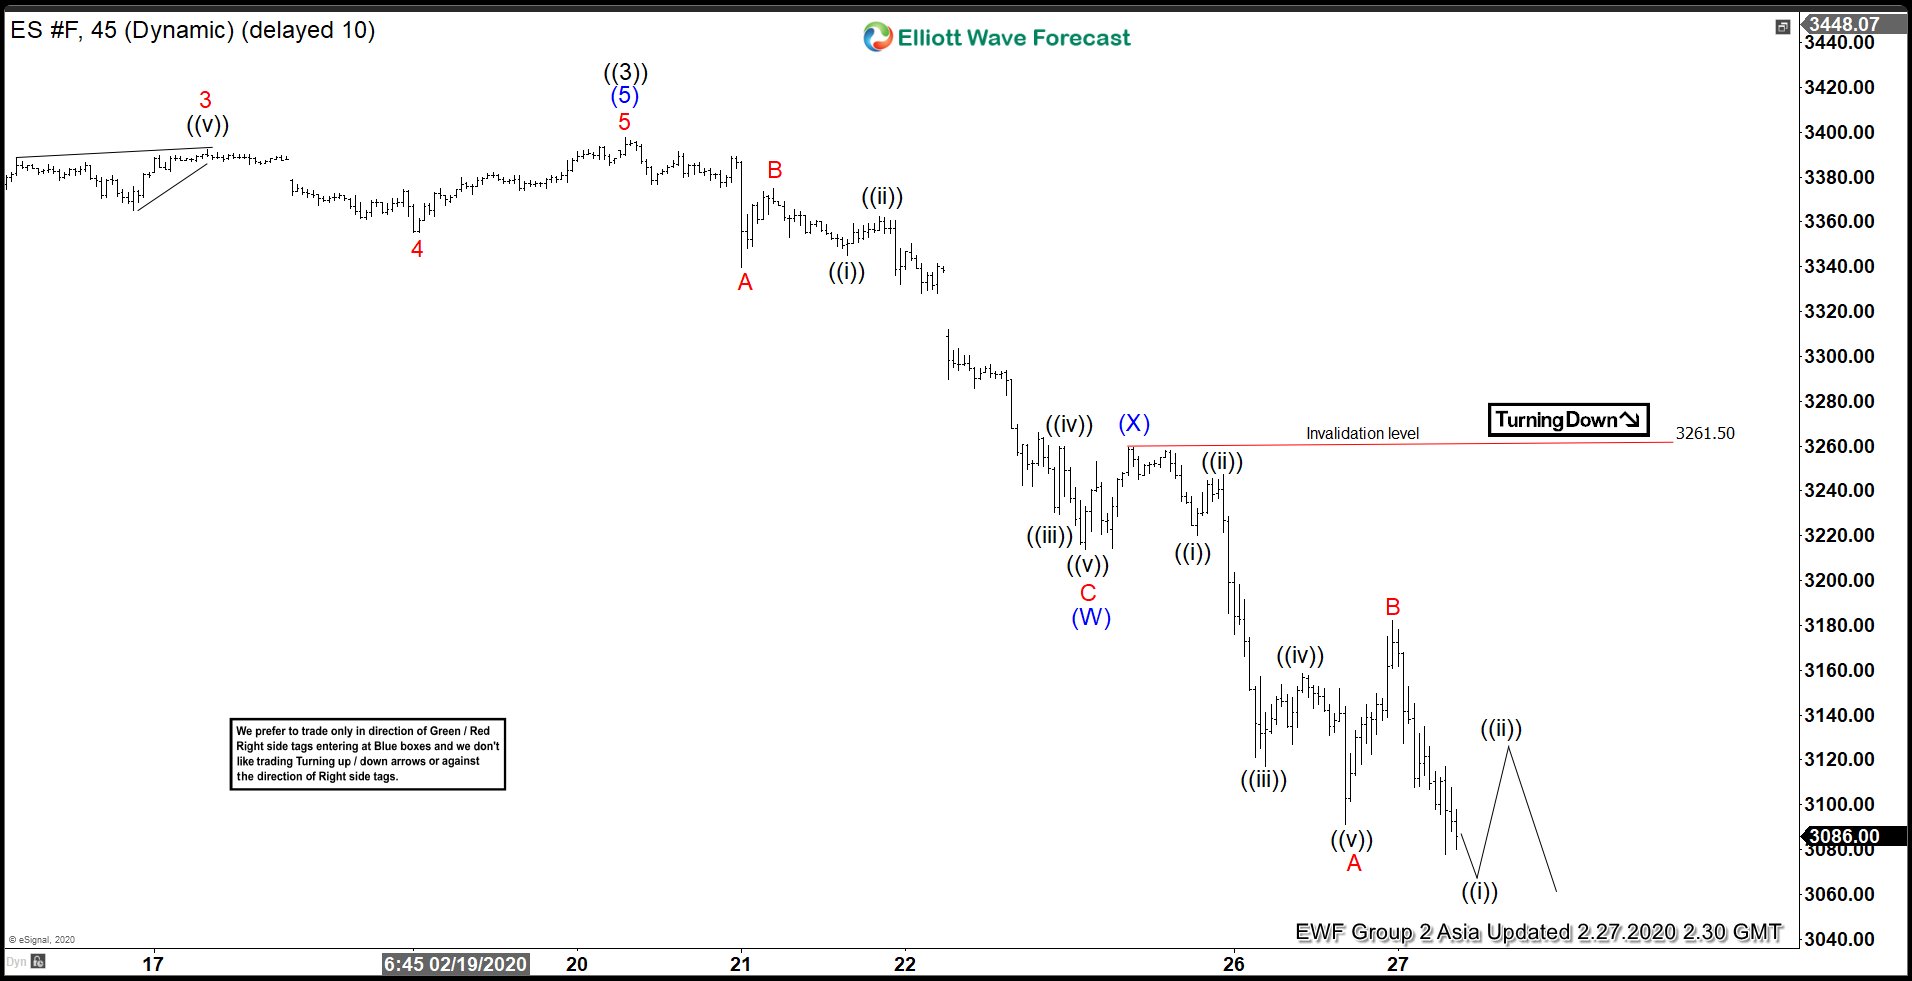
Short term Elliott Wave view in E-mini S&P 500 (ES_F) suggests the Index ended the cycle up from June 3, 2019 low in wave ((3)) at 3397.50 high. The index is correcting that cycle in wave ((4)) as a double correction. Wave A of (W) ended at 3339.50 low. The bounce in wave B ended at 3375 high. It then resumed lower in wave C, which ended at 3213.75 low. The index then bounced higher in wave (X) and ended at 3261.50 high.
Down from wave (X) high, the index resumed lower in wave A of (Y) and ended at 3091 low. The internal subdivision of wave A unfolded as a 5 waves impulse Elliott Wave structure. Wave ((i)) ended at 3220.25 low. It then bounced in wave ((ii)) and ended at 3247.25 high. From there, wave ((iii)) extended lower and ended at 3117.25 low and wave ((iv)) bounce ended at 3158.50 high. The index then resumed lower and ended wave ((v)) at 3091 low. Up from wave A low, wave B bounced higher and ended at 3182 high. Currently, the index is continuing lower in wave C of (Y). Wave ((i)) remains in progress followed by a bounce in wave ((ii)) later. While below 3261.50 high, the bounce in 3,7, or 11 swings is expected to fail. The index can see more downside to complete wave ((4)) correction before upside resumes. Potential area to end wave C of ((4)) is 100% – 123.6% Fibonacci extension of wave A-B which comes at 2974-3014 area.
E-mini S&P 500 (ES_F) 1 Hour Elliott Wave Chart