Hello fellow traders. In this technical blog we’re going to take a quick look at the Elliott Wave charts of BABA. As our members know BABA has recently given us pull back against the 199.12 low. Pull back unfolded as Elliott Wave Zig Zag Pattern. We expected buyers to appear at the Blue Box , calling for rally in 3 waves bounce at least. In the further text we are going to explain the Elliott Wave Pattern and the Forecast.
Before we take a look at the real market example, let’s explain Elliott Wave Zigzag pattern.
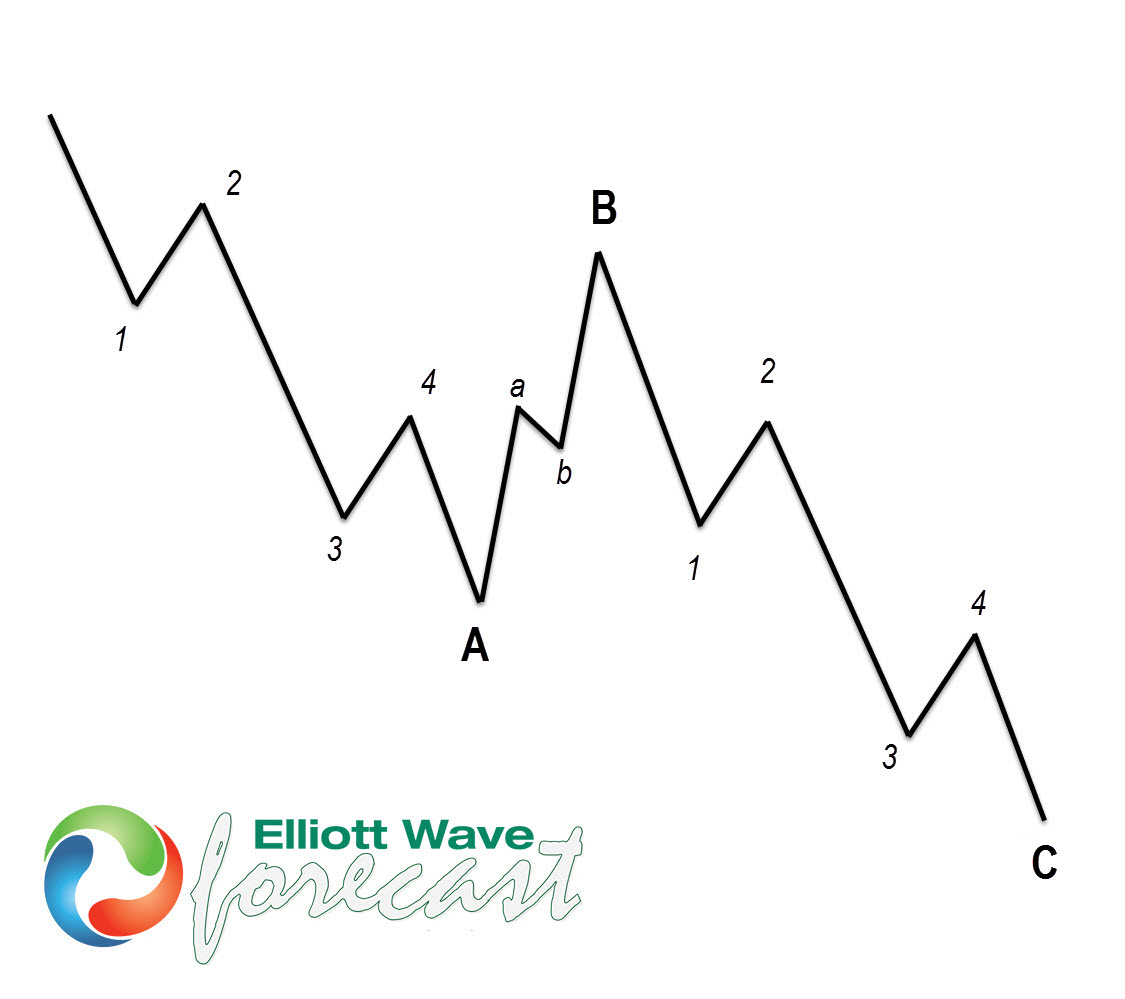
Elliott Wave Zig Zag Pattern
Elliott Wave Zigzag is the most popular corrective pattern in Elliott Wave theory . It’s made of 3 swings which have 5-3-5 inner structure. Inner swings are labeled as A,B,C where A =5 waves, B=3 waves and C=5 waves. That means A and C can be either impulsive waves or diagonals. (Leading Diagonal in case of wave A or Ending in case of wave C) . Waves A and C must meet all conditions of being 5 wave structure, such as: having RSI divergency between wave subdivisions, ideal Fibonacci extensions and ideal retracements.
At the graphic below, we can see what Elliott Wave Zigzag structure looks like. 5 waves down in A, 3 waves bounce in B and another 5 waves down in C.
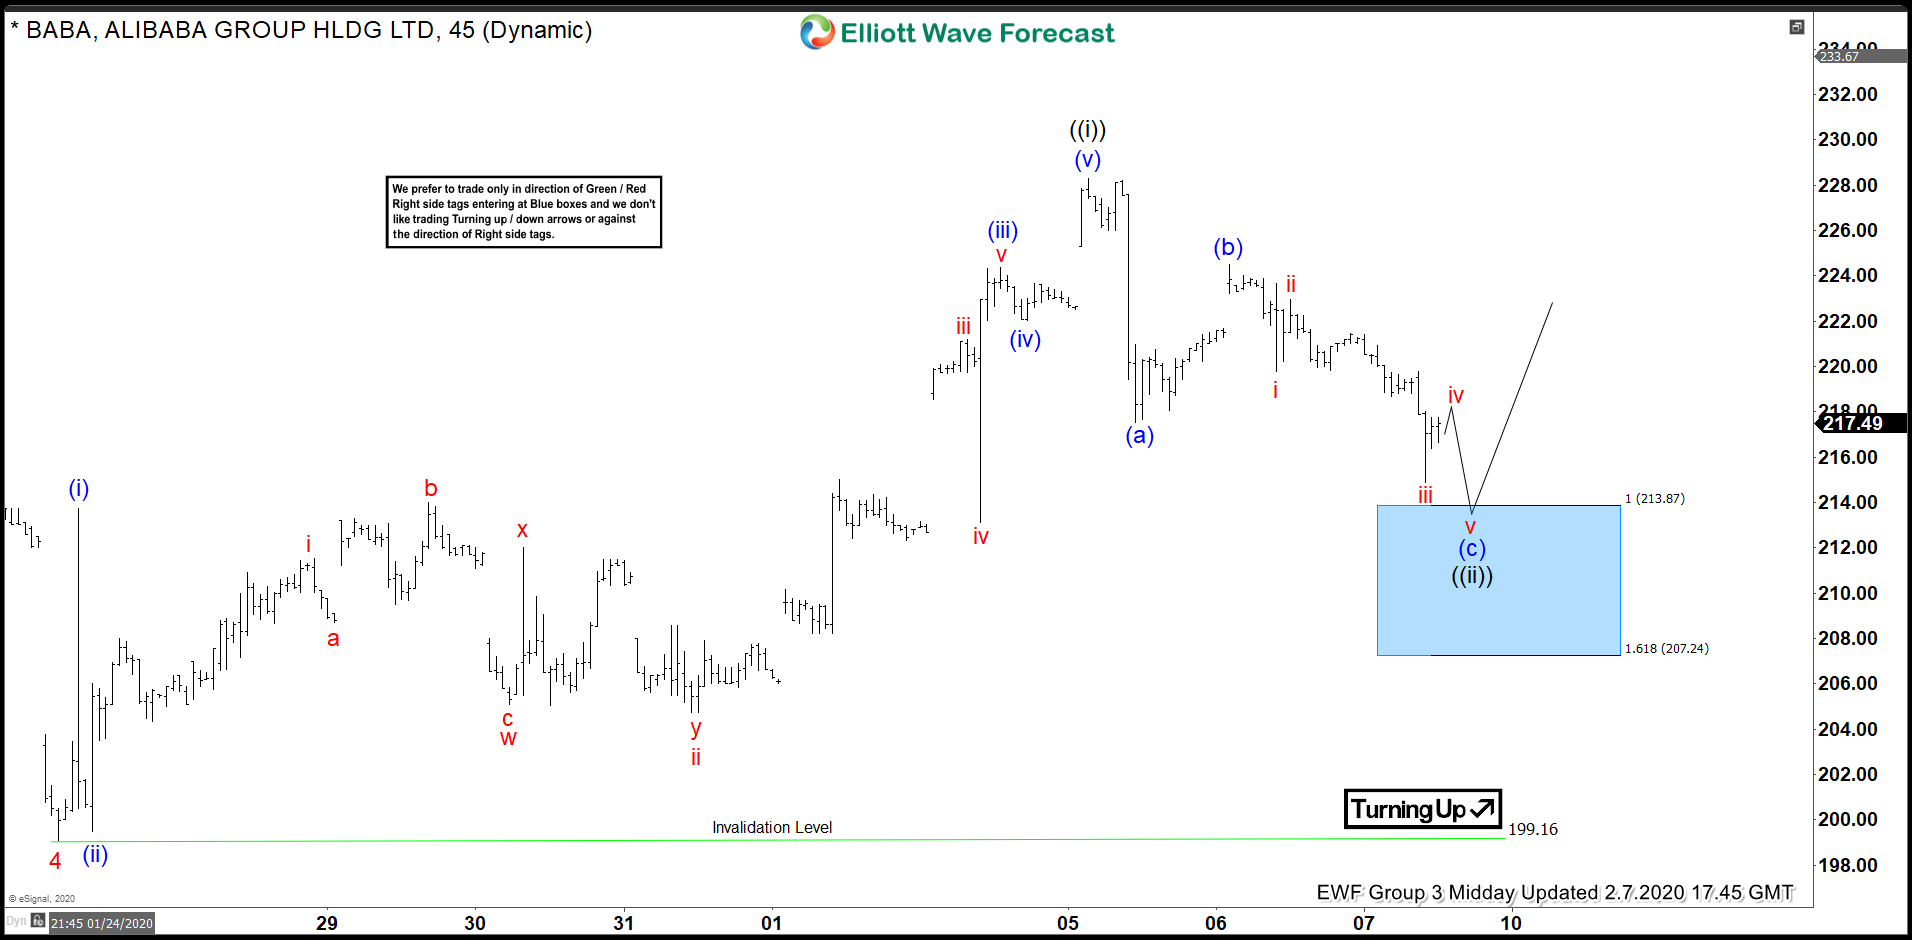
BABA 1 Hour Elliott Wave Analysis 2.7.2020
As we can see on the chart, we are getting 3 waves down in wave ((ii)) black pull back. Pull back is unfolding as (a)(b)(c) Elliott Wave Zig Zag pattern. First leg (a) was a very sharp decline, which is obviously impulsive structure. ( 5 waves are not labeled on this chart but they’re visible on lower time frames) . Then we got 3 wave bounces in wave (b) . And finally, doing last leg down (c), which is still in progress. Pull back looks incomplete at the moment,missing equal legs : 213.87-207.2 area. We expect last push down to take place soon, to complete 5 waves in (c) leg. We don’t recommend selling the stock.
You can learn more about Zig Zag Elliott Wave Patterns at our Free Elliott Wave Educational Web Page.
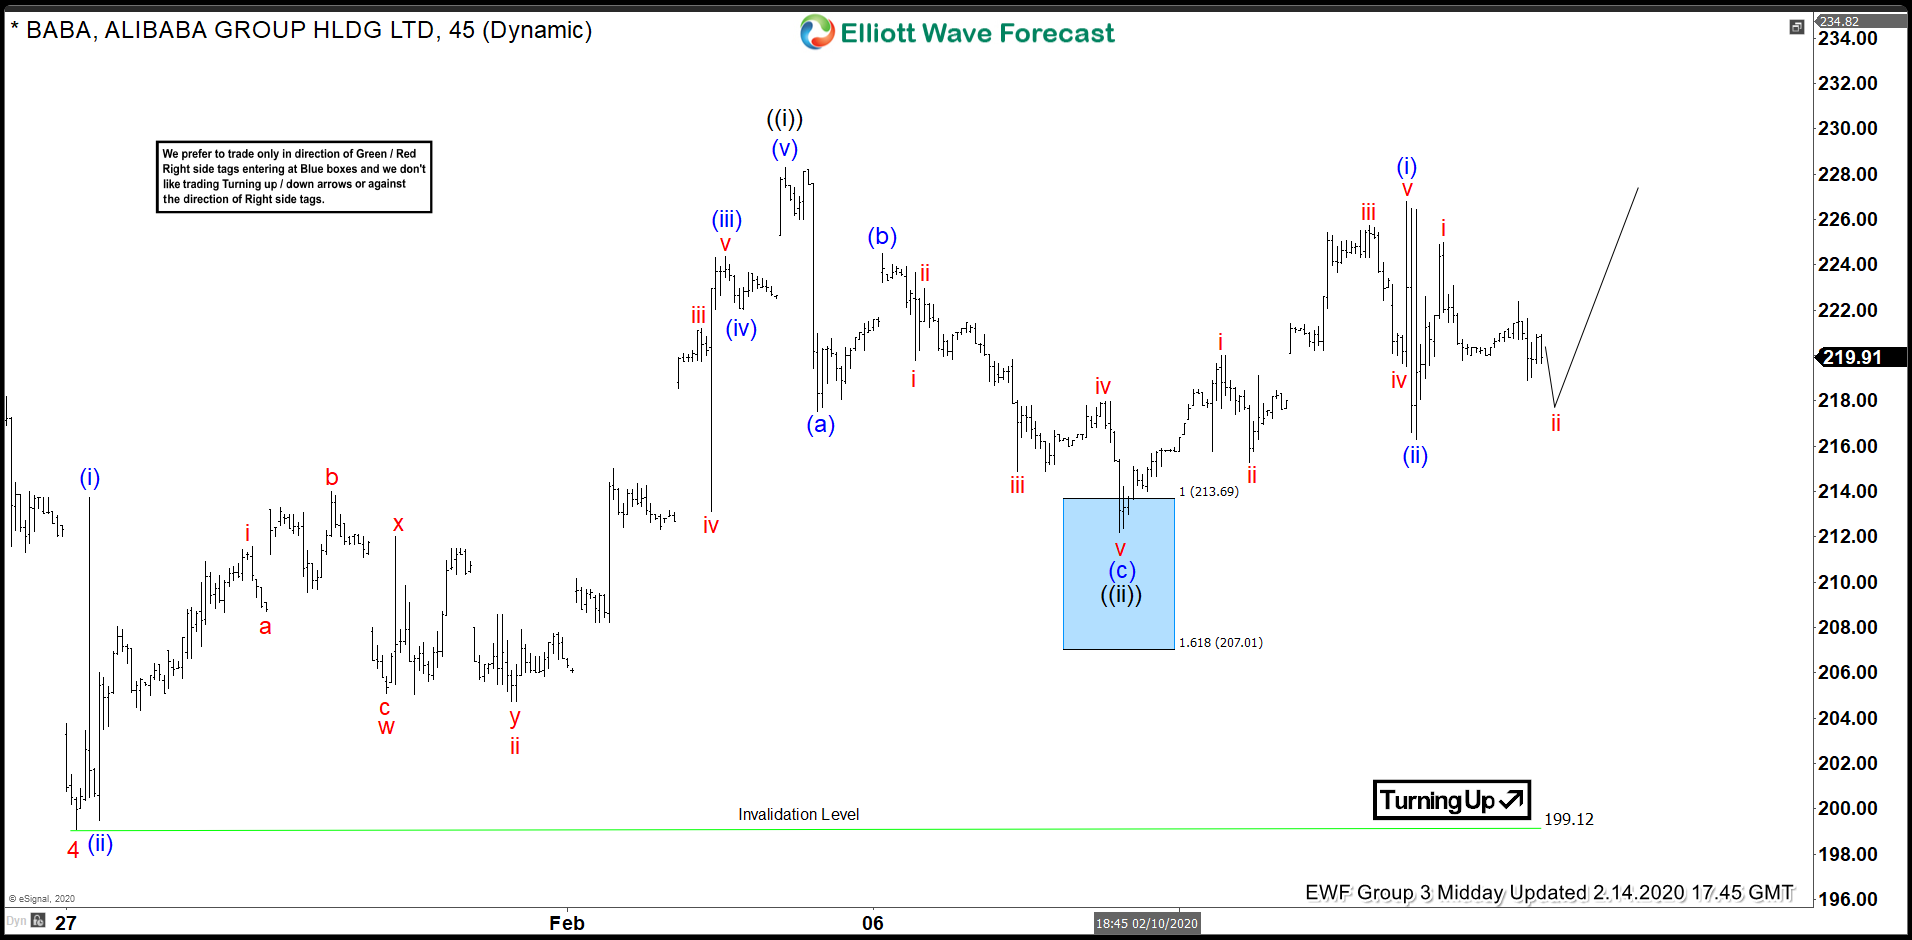
BABA 1 Hour Elliott Wave Analysis 2.14.2020
BABA found buyers right at the blue box area :213.87-207.2 area. The pull back wave ((ii)) completed as Elliott Wave Zig Zag at the 212.35 low. We got nice rally from there, however need to see break above 02/05 peak to confirm wave ((iii)) is in progress.
Keep in mind market is dynamic and presented view could have changed in the mean time. You can check most recent charts in the membership area of the site. Best instruments to trade are those having incomplete bullish or bearish swings sequences.We put them in Sequence Report and best among them are shown in the Live Trading Room
Elliott Wave Forecast